During the projected period, the market for green and bio-based solvents is anticipated to expand at a CAGR of about 7.8%. Strict regulations on VOC emissions and other dangerous air pollutants, as well as growing market penetration of bio-based and green solvents in Asia-Pacific, are major drivers of the market under study.
The market will benefit from the shift of petrochemical and fuel products towards renewable resources as well as from increased government assistance for the development of green and bio-based solvents.
Asia-Pacific led the market globally, with countries like China, India, and others having the highest consumption rates.
The worldwide green and bio-solvent market is divided into bio-alcohols, bio-glycols, bio-diols, ethyl lactate, D-limonene, and methyl soyate and is then subdivided and examined for demand and supply by type. Out of these, it is predicted that the D-limonene category would increase its market share to nearly 28% by 2035. The rising usage of flavouring agents in all kinds of drinks and meals is to blame for the segment’s expansion. The expansion of the market sector is being driven by the expanding food and beverage industry globally.
According to estimates, the market segment will develop due to the expanding use in the health sector. D-limonene functions as an antioxidant to treat skin sensitivity and irritation, as well as lowering cholesterol and gastrointestinal problems. The market category is expanding as consumer desire for eco-friendly products is on the rise. The market sector is expanding as a result of rising fungal diseases and the number of people who have cholesterol problems. D-limonene’s market value was predicted to rise from an anticipated USD 480 million in 2021 to over USD 700 million by the end of 2030.
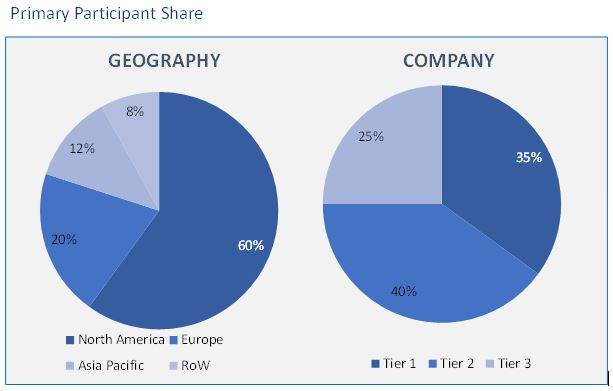
Research Methodology:
In order to produce the most precise estimations and forecasts, our study uses an extensive and iterative research technique that is focused on reducing deviation. For market segmentation and quantitative estimation, the business combines top-down and bottom-up methods. In addition, data triangulation, which examines the market from three separate angles, is a recurrent topic present in all of our research studies. The market for green and bio-based solvents is divided into categories depending on type, including alcohols, glycols, diols, lactate esters, d-limonene, and methyl soyate. The market is divided into industrial and household cleansers, paints and coatings, adhesives, printing inks, medicines, cosmetics, and others based on application. The market is divided into five regions based on where it is geographically located: North America, Europe, Asia Pacific, Latin America, and the Middle East & Africa. The primary participants share is given below:
Green and Bio-Solvents Market based on Type:
- Ester Solvents
- D-Limonene
- Alcohols, Glycols & Diols Solvents
- Others
Green and Bio-Solvents Market on Application:
- Paints and Coatings
- Adhesives & Sealants
- Printing Ink
- Industrial & Domestic Cleaners
- Others (Pharmaceutical and personal care)
Green and Bio-Solvents Market based on Geography:
- North America
- Europe
- Germany
- UK
- France
- Italy
- Spain
- Rest of Europe (RoE)
- Asia Pacific (APAC)
- China
- Japan
- India
- Australia
- South Korea
- Rest of Asia Pacific (RoAPAC)
- Latin America (LATAM)
- Brazil
- Argentina
- Rest of South America
- Middle East and Africa (MEA)
- UAE
- Turkey
- Saudi Arabia
- South Africa
- Rest of Middle East & Africa
The Global Green and Bio-Based Solvents Market has been divided into bio-alcohols, bio-glycols, bio-diols, ethyl lactate, D-limonene, methyl soyate, and others (including hydrogen peroxide, bio-based butanediol, 2-methyltetrahydrofuran, etc.) on the basis of type.
The market for green and bio-based solvents has been segmented based on application into paints and coatings, residential and commercial cleaning, printing inks, adhesives and sealants, pharmaceutical, cosmetics, and agricultural, among others.
Five major regions have been examined in The Global Green and Bio-Based Solvents Market: Asia-Pacific, North America, Latin America, Europe, and the Middle East & Africa.
- This report illustrates the most vital attributes of the Green and Bio-Solvents Market, which are driving and providing opportunities.
- This research gives an in-depth analysis of the Green and Bio-Solvents Market growth on the basis of several segments in the market.
- This report presents the predictions of the past and present trends of the Green and Bio-Solvents Market.
- This study also presents the competitive analysis, such as key strategies and capabilities of major players of the Green and Bio-Solvents Market.
List of Tables
TABLE 1. GREEN AND BIO-SOLVENTS MARKET, BY TYPE, 2021-2030 (USD BILLION)
TABLE 2. GREEN AND BIO-SOLVENTS MARKET FOR Ester Solvents, BY GEOGRAPHY, 2021-2030 (USD BILLION)
TABLE 3. GREEN AND BIO-SOLVENTS MARKET FOR D-Limonene, BY GEOGRAPHY, 2021-2030 (USD BILLION)
TABLE 4. GREEN AND BIO-SOLVENTS MARKET FOR Alcohols, Glycols & Diols Solvents, BY GEOGRAPHY, 2021-2030 (USD BILLION)
TABLE 5. GREEN AND BIO-SOLVENTS MARKET FOR Others, BY GEOGRAPHY, 2021-2030 (USD BILLION)
TABLE 6. GREEN AND BIO-SOLVENTS MARKET, BY APPLICATION, 2021-2030 (USD BILLION)
TABLE 7. GREEN AND BIO-SOLVENTS MARKET FOR Paints and Coatings, 2021-2030 (USD BILLION)
TABLE 8. GREEN AND BIO-SOLVENTS MARKET FOR Adhesives & Sealants, 2021-2030 (USD BILLION)
TABLE 9. GREEN AND BIO-SOLVENTS MARKET FOR Printing Ink, 2021-2030 (USD BILLION)
TABLE 10. GREEN AND BIO-SOLVENTS MARKET FOR Industrial & Domestic Cleaners, 2021-2030 (USD BILLION)
TABLE 11. GREEN AND BIO-SOLVENTS MARKET FOR Others (Pharmaceutical and personal care), 2021-2030 (USD BILLION)
TABLE 12. NORTH AMERICA GREEN AND BIO-SOLVENTS MARKET, BY COUNTRY, 2021-2030 (USD BILLION)
TABLE 13. NORTH AMERICA GREEN AND BIO-SOLVENTS MARKET, BY TYPE, 2021-2030 (USD BILLION)
TABLE 14. NORTH AMERICA GREEN AND BIO-SOLVENTS MARKET, BY APPLICATION, 2021-2030 (USD BILLION)
TABLE 15. U.S GREEN AND BIO-SOLVENTS MARKET, BY TYPE, 2021-2030 (USD BILLION)
TABLE 16. U.S GREEN AND BIO-SOLVENTS MARKET, BY APPLICATION, 2021-2030 (USD BILLION)
TABLE 17. CANADA GREEN AND BIO-SOLVENTS MARKET, BY TYPE, 2021-2030 (USD BILLION)
TABLE 18. CANADA GREEN AND BIO-SOLVENTS MARKET, BY APPLICATION, 2021-2030 (USD BILLION)
TABLE 19. MEXICO GREEN AND BIO-SOLVENTS MARKET, BY TYPE, 2021-2030 (USD BILLION)
TABLE 20. MEXICO GREEN AND BIO-SOLVENTS MARKET, BY APPLICATION, 2021-2030 (USD BILLION)
TABLE 21. EUROPE GREEN AND BIO-SOLVENTS MARKET, BY COUNTRY, 2021-2030 (USD BILLION)
TABLE 22. EUROPE GREEN AND BIO-SOLVENTS MARKET, BY TYPE, 2021-2030 (USD BILLION)
TABLE 23. EUROPE GREEN AND BIO-SOLVENTS MARKET, RANGE, 2021-2030 (USD BILLION)
TABLE 24. GERMANY GREEN AND BIO-SOLVENTS MARKET, BY TYPE, 2021-2030 (USD BILLION)
TABLE 25. GERMANY GREEN AND BIO-SOLVENTS MARKET, BY APPLICATION, 2021-2030 (USD BILLION)
TABLE 26. U.K GREEN AND BIO-SOLVENTS MARKET, BY TYPE, 2021-2030 (USD BILLION)
TABLE 27. U.K GREEN AND BIO-SOLVENTS MARKET, BY APPLICATION, 2021-2030 (USD BILLION)
TABLE 28. FRANCE GREEN AND BIO-SOLVENTS MARKET, BY TYPE, 2021-2030 (USD BILLION)
TABLE 29. FRANCE GREEN AND BIO-SOLVENTS MARKET, BY APPLICATION, 2021-2030 (USD BILLION)
TABLE 30. ITALY GREEN AND BIO-SOLVENTS MARKET, BY TYPE, 2021-2030 (USD BILLION)
TABLE 31. ITALY GREEN AND BIO-SOLVENTS MARKET, BY APPLICATION, 2021-2030 (USD BILLION)
TABLE 32. SPAIN GREEN AND BIO-SOLVENTS MARKET, BY TYPE, 2021-2030 (USD BILLION)
TABLE 33. SPAIN GREEN AND BIO-SOLVENTS MARKET, BY APPLICATION, 2021-2030 (USD BILLION)
TABLE 34. ROE GREEN AND BIO-SOLVENTS MARKET, BY TYPE, 2021-2030 (USD BILLION)
TABLE 35. ROE GREEN AND BIO-SOLVENTS MARKET, BY APPLICATION, 2021-2030 (USD BILLION)
TABLE 36. ASIA PACIFIC GREEN AND BIO-SOLVENTS MARKET, BY COUNTRY, 2021-2030 (USD BILLION)
TABLE 37. ASIA PACIFIC GREEN AND BIO-SOLVENTS MARKET, BY TYPE, 2021-2030 (USD BILLION)
TABLE 38. ASIA PACIFIC GREEN AND BIO-SOLVENTS MARKET, BY APPLICATION, 2021-2030 (USD BILLION)
TABLE 39. CHINA GREEN AND BIO-SOLVENTS MARKET, BY TYPE, 2021-2030 (USD BILLION)
TABLE 40. CHINA GREEN AND BIO-SOLVENTS MARKET, BY APPLICATION, 2021-2030 (USD BILLION)
TABLE 41. INDIA GREEN AND BIO-SOLVENTS MARKET, BY TYPE, 2021-2030 (USD BILLION)
TABLE 42. INDIA GREEN AND BIO-SOLVENTS MARKET, BY APPLICATION, 2021-2030 (USD BILLION)
TABLE 43. JAPAN GREEN AND BIO-SOLVENTS MARKET, BY TYPE, 2021-2030 (USD BILLION)
TABLE 44. JAPAN GREEN AND BIO-SOLVENTS MARKET, BY APPLICATION, 2021-2030 (USD BILLION)
TABLE 45. REST OF APAC GREEN AND BIO-SOLVENTS MARKET, BY TYPE, 2021-2030 (USD BILLION)
TABLE 46. REST OF APAC GREEN AND BIO-SOLVENTS MARKET, BY APPLICATION, 2021-2030 (USD BILLION)
TABLE 47. LATIN AMERICA GREEN AND BIO-SOLVENTS MARKET, BY TYPE, 2021-2030 (USD BILLION)
TABLE 48. LATIN AMERICA GREEN AND BIO-SOLVENTS MARKET, BY APPLICATION, 2021-2030 (USD BILLION)
TABLE 49. BRAZIL GREEN AND BIO-SOLVENTS MARKET, BY TYPE, 2021-2030 (USD BILLION)
TABLE 50. BRAZIL GREEN AND BIO-SOLVENTS MARKET, BY APPLICATION, 2021-2030 (USD BILLION)
TABLE 51. ARGENTINA GREEN AND BIO-SOLVENTS MARKET, BY TYPE, 2021-2030 (USD BILLION)
TABLE 52. ARGENTINA GREEN AND BIO-SOLVENTS MARKET, BY APPLICATION, 2021-2030 (USD BILLION)
TABLE 53. MIDDLE EAST AND AFRICA GREEN AND BIO-SOLVENTS MARKET, BY TYPE, 2021-2030 (USD BILLION)
TABLE 54. MIDDLE EAST AND AFRICA GREEN AND BIO-SOLVENTS MARKET, BY APPLICATION, 2021-2030 (USD BILLION)
TABLE 55. SAUDI ARABIA GREEN AND BIO-SOLVENTS MARKET, BY TYPE, 2021-2030 (USD BILLION)
TABLE 56. SAUDI ARABIA GREEN AND BIO-SOLVENTS MARKET, BY APPLICATION, 2021-2030 (USD BILLION)
TABLE 57. UAE GREEN AND BIO-SOLVENTS MARKET, BY TYPE, 2021-2030 (USD BILLION)
TABLE 58. UAE GREEN AND BIO-SOLVENTS MARKET, BY APPLICATION, 2021-2030 (USD BILLION)
TABLE 59. REST OF MIDDLE EAST AND AFRICA GREEN AND BIO-SOLVENTS MARKET, BY TYPE, 2021-2030 (USD BILLION)
TABLE 60. REST OF MIDDLE EAST AND AFRICA GREEN AND BIO-SOLVENTS MARKET, BY APPLICATION, 2021-2030 (USD BILLION)
TABLE 61. BASF SE: FINANCIALS
TABLE 62. BASF SE: PRODUCTS & SERVICES
TABLE 63. BASF SE: RECENT DEVELOPMENTS
TABLE 64. CARGILL INC.: FINANCIALS
TABLE 65. CARGILL INC.: PRODUCTS & SERVICES
TABLE 66. CARGILL INC.: RECENT DEVELOPMENTS
TABLE 67. CLARIANT: FINANCIALS
TABLE 68. CLARIANT: PRODUCTS & SERVICES
TABLE 69. CLARIANT: RECENT DEVELOPMENTS
TABLE 70. DUPONT: FINANCIALS
TABLE 71. DUPONT: PRODUCTS & SERVICES
TABLE 72. DUPONT: RECENT DEVELOPMENTS
TABLE 73. HUNTSMAN CORP: FINANCIALS
TABLE 74. HUNTSMAN CORP: PRODUCTS & SERVICES
TABLE 75. HUNTSMAN CORP: RECENT DEVELOPMENTS
TABLE 76. LYONDELLBASELL INDUSTRIES HOLDINGS B.V.: FINANCIALS
TABLE 77. LYONDELLBASELL INDUSTRIES HOLDINGS B.V.: PRODUCTS & SERVICES
TABLE 78. LYONDELLBASELL INDUSTRIES HOLDINGS B.V.: RECENT DEVELOPMENTS
TABLE 79. OQ SAOC: FINANCIALS
TABLE 80. OQ SAOC: PRODUCTS & SERVICES
TABLE 81. OQ SAOC: RECENT DEVELOPMENTS
TABLE 82. SASOL: FINANCIALS
TABLE 83. SASOL: PRODUCTS & SERVICES
TABLE 84. SASOL: RECENT DEVELOPMENTS
TABLE 85. SOLVAY S.A: FINANCIALS
TABLE 86. SOLVAY S.A: PRODUCTS & SERVICES
TABLE 87. SOLVAY S.A: RECENT DEVELOPMENTS
TABLE 88. VERTEC BIOSOLVENTS INC.: FINANCIALS
TABLE 89. VERTEC BIOSOLVENTS INC.: PRODUCTS & SERVICES
TABLE 90. VERTEC BIOSOLVENTS INC.: RECENT DEVELOPMENTS


