An energy recovery system assists in converting a significant quantity of waste energy, storing it, and reusing it to power auxiliary vehicle functions or provide an extra boost to the engine when needed. For instance, the regenerative braking mechanism in electric automobiles uses some of its kinetic energy to charge the battery. The need for automotive energy recovery systems is primarily being driven by environmentally friendly technologies, the hunt for better vehicle performance, and strict fuel efficiency rules.
Government restrictions for pollution and performance in the passenger car market are expected to become more strict in the next years in regions like Europe and Asia-Pacific, particularly in China, India, and Japan. The market for vehicle energy recovery systems is anticipated to grow as a result. The market for vehicle energy recovery systems would be greatly impacted by the impending laws in various nations. These systems will eventually be required in developed nations.
In terms of volume and value, this study categorises and describes the market for automotive energy recovery systems. This research offers in-depth market assessments and insights (both qualitative and quantitative). The research reviews the market’s drivers, restraints, growth indicators, challenges, legislative trends, market dynamics, competitive landscape, and other important market elements while highlighting potential growth prospects in the upcoming years. Additionally, the major companies in this area have been named and profiled.
Research Methodology:
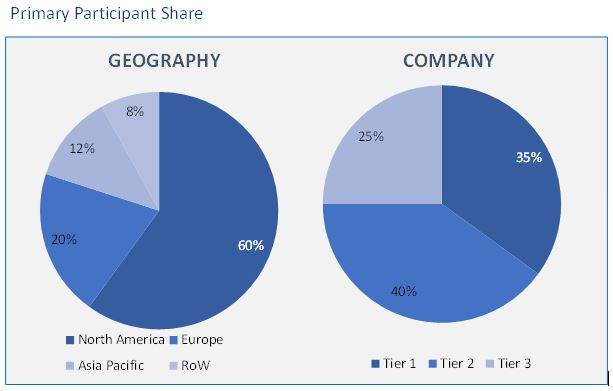
The report’s goal is to provide a thorough analysis of the Automotive Energy Recovery Systems Market, taking into account all relevant market players. The research analyses complex data in plain terms and shows the historical and current state of the industry together with projected market size and trends. The report examines important companies, including market leaders, followers, and new entries by region, in detail and covers all areas of the industry. The research includes PORTER, SVOR, and PESTEL analyses along with the prospective market impact of regional micro-economic factors. Analysis of both internal and external variables that could positively or negatively impact the firm will provide the decision-maker with a clear, futuristic vision of the sector.The primary participants share is given below:
Automotive Energy Recovery Systems Market based on Product type:
- Regenerative Braking System
- Turbocharger
- Exhaust Gas Recirculation
Automotive Energy Recovery Systems Market based on Vehicle type:
- Passenger Cars
- Commercial Vehicles
- Electric Vehicles
Automotive Energy Recovery Systems Market based on Geography:
- North America
- Europe
- Germany
- UK
- France
- Italy
- Spain
- Rest of Europe (RoE)
- Asia Pacific (APAC)
- China
- Japan
- India
- Australia
- South Korea
- Rest of Asia Pacific (RoAPAC)
- Latin America (LATAM)
- Brazil
- Argentina
- Rest of South America
- Middle East and Africa (MEA)
- UAE
- Turkey
- Saudi Arabia
- South Africa
- Rest of Middle East & Africa
The market is divided into three categories based on product type: exhaust gas recirculation, turbocharge, and regenerative braking system. As a vehicle slows down, kinetic energy is captured by regenerative braking systems and other automotive energy recovery systems, which then transform it into electrical energy. The electrical energy could subsequently be used to power the vehicle’s other systems or it could be stored in batteries. Any green transportation strategy must include regenerative braking systems for cars since they help lower emissions and increase fuel efficiency.
The market is divided into three categories based on the kind of vehicle: passenger cars, commercial vehicles, and electric vehicles. The largest share was in the passenger automobile application sector, and it is anticipated that it would continue to lead during the anticipated period. Regenerative braking systems use part of the energy that is lost as heat by the brake pads and tyres to power the wheels of cars. The need for effective person and cargo transportation, which has driven up the cost of these vehicles, is another driving force.
The Global Automotive Energy Recovery Systems Market is segmented into North America, Europe, Asia-Pacific, and the Rest of the World based on geographical analysis. In 2015, the region’s revenue share was greater than 35%, and it is anticipated that as more light trucks and vehicles are sold, it will continue to grow dramatically.
The vehicle energy recovery systems market is expanding faster and has a greater penetration rate in Europe and North America. Due to the rise in consumer spending power and their choice for low emission vehicles, the adoption of these systems is also expanding significantly in the Asia-Oceania and RoW areas. According to projections, the vehicle energy recovery systems’ biggest markets will be in Brazil, France, the United States, Japan, and Japan. From 2014 through 2019, it is anticipated that developing nations like Mexico, the Netherlands, and India would have rapid economic development.
- This report illustrates the most vital attributes of the Automotive Energy Recovery Systems, which are driving and providing opportunities.
- This research gives an in-depth analysis of the Automotive Energy Recovery Systems growth on the basis of several segments in the market.
- This report presents the predictions of the past and present trends of the Automotive Energy Recovery Systems Market.
- This study also presents the competitive analysis, such as key strategies and capabilities of major players of the Automotive Energy Recovery Systems Market.
List of Tables
TABLE 1. AUTOMOTIVE ENERGY RECOVERY SYSTEMS MARKET, BY PRODUCT TYPE, 2021-2030 (USD BILLION)
TABLE 2. AUTOMOTIVE ENERGY RECOVERY SYSTEMS MARKET FOR REGENARATIVE BRAKING SYSTEM, BY GEOGRAPHY, 2021-2030 (USD BILLION)
TABLE 3. AUTOMOTIVE ENERGY RECOVERY SYSTEMS MARKET FOR TURBOCHARGER, BY GEOGRAPHY, 2021-2030 (USD BILLION)
TABLE 4. AUTOMOTIVE ENERGY RECOVERY SYSTEMS MARKET FOR EXHAUST GAS RECIRCULATION, BY GEOGRAPHY, 2021-2030 (USD BILLION)
TABLE 5. AUTOMOTIVE ENERGY RECOVERY SYSTEMS MARKET, BY VEHICLE TYPE, 2021-2030 (USD BILLION)
TABLE 6. AUTOMOTIVE ENERGY RECOVERY SYSTEMS MARKET FOR PASSENGER VEHICLE, 2021-2030 (USD BILLION)
TABLE 7. AUTOMOTIVE ENERGY RECOVERY SYSTEMS MARKET FOR COMMERCIAL VEHICLE, 2021-2030 (USD BILLION)
TABLE 8. AUTOMOTIVE ENERGY RECOVERY SYSTEMS MARKET FOR ELECTRIC VEHICLE, 2021-2030 (USD BILLION)
TABLE 9. NORTH AMERICA AUTOMOTIVE ENERGY RECOVERY SYSTEMS MARKET, BY COUNTRY, 2021-2030 (USD BILLION)
TABLE 10. NORTH AMERICA AUTOMOTIVE ENERGY RECOVERY SYSTEMS MARKET, BY PRODUCT TYPE, 2021-2030 (USD BILLION)
TABLE 11. NORTH AMERICA AUTOMOTIVE ENERGY RECOVERY SYSTEMS MARKET, BY VEHICLE TYPE, 2021-2030 (USD BILLION)
TABLE 12. NORTH AMERICA AUTOMOTIVE ENERGY RECOVERY SYSTEMS MARKET, BY REGION, 2021-2030 (USD BILLION)
TABLE 13. U.S AUTOMOTIVE ENERGY RECOVERY SYSTEMS MARKET, BY PRODUCT TYPE, 2021-2030 (USD BILLION)
TABLE 14. U.S AUTOMOTIVE ENERGY RECOVERY SYSTEMS MARKET, BY VEHICLE TYPE, 2021-2030 (USD BILLION)
TABLE 15. U.S AUTOMOTIVE ENERGY RECOVERY SYSTEMS MARKET, BY REGION, 2021-2030 (USD BILLION)
TABLE 16. CANADA AUTOMOTIVE ENERGY RECOVERY SYSTEMS MARKET, BY PRODUCT TYPE, 2021-2030 (USD BILLION)
TABLE 17. CANADA AUTOMOTIVE ENERGY RECOVERY SYSTEMS MARKET, BY VEHICLE TYPE, 2021-2030 (USD BILLION)
TABLE 18. CANADA AUTOMOTIVE ENERGY RECOVERY SYSTEMS MARKET, BY REGION, 2021-2030 (USD BILLION)
TABLE 19. MEXICO AUTOMOTIVE ENERGY RECOVERY SYSTEMS MARKET, BY PRODUCT TYPE, 2021-2030 (USD BILLION)
TABLE 20. MEXICO AUTOMOTIVE ENERGY RECOVERY SYSTEMS MARKET, BY VEHICLE TYPE, 2021-2030 (USD BILLION)
TABLE 21. MEXICO AUTOMOTIVE ENERGY RECOVERY SYSTEMS MARKET, BY REGION, 2021-2030 (USD BILLION)
TABLE 22. EUROPE AUTOMOTIVE ENERGY RECOVERY SYSTEMS MARKET, BY COUNTRY, 2021-2030 (USD BILLION)
TABLE 23. EUROPE AUTOMOTIVE ENERGY RECOVERY SYSTEMS MARKET, BY PRODUCT TYPE, 2021-2030 (USD BILLION)
TABLE 24. EUROPE AUTOMOTIVE ENERGY RECOVERY SYSTEMS MARKET, BY VEHICLE TYPE, 2021-2030 (USD BILLION)
TABLE 25. EUROPE AUTOMOTIVE ENERGY RECOVERY SYSTEMS MARKET, RANGE, 2021-2030 (USD BILLION)
TABLE 26. GERMANY AUTOMOTIVE ENERGY RECOVERY SYSTEMS MARKET, BY PRODUCT TYPE, 2021-2030 (USD BILLION)
TABLE 27. GERMANY AUTOMOTIVE ENERGY RECOVERY SYSTEMS MARKET, BY VEHICLE TYPE, 2021-2030 (USD BILLION)
TABLE 28. GERMANY AUTOMOTIVE ENERGY RECOVERY SYSTEMS MARKET, BY REGION, 2021-2030 (USD BILLION)
TABLE 29. U.K AUTOMOTIVE ENERGY RECOVERY SYSTEMS MARKET, BY PRODUCT TYPE, 2021-2030 (USD BILLION)
TABLE 30. U.K AUTOMOTIVE ENERGY RECOVERY SYSTEMS MARKET, BY VEHICLE TYPE, 2021-2030 (USD BILLION)
TABLE 31. U.K AUTOMOTIVE ENERGY RECOVERY SYSTEMS MARKET, BY REGION, 2021-2030 (USD BILLION)
TABLE 32. FRANCE AUTOMOTIVE ENERGY RECOVERY SYSTEMS MARKET, BY PRODUCT TYPE, 2021-2030 (USD BILLION)
TABLE 33. FRANCE AUTOMOTIVE ENERGY RECOVERY SYSTEMS MARKET, BY VEHICLE TYPE, 2021-2030 (USD BILLION)
TABLE 34. FRANCE AUTOMOTIVE ENERGY RECOVERY SYSTEMS MARKET, BY REGION, 2021-2030 (USD BILLION)
TABLE 35. ITALY AUTOMOTIVE ENERGY RECOVERY SYSTEMS MARKET, BY PRODUCT TYPE, 2021-2030 (USD BILLION)
TABLE 36. ITALY AUTOMOTIVE ENERGY RECOVERY SYSTEMS MARKET, BY VEHICLE TYPE, 2021-2030 (USD BILLION)
TABLE 37. ITALY AUTOMOTIVE ENERGY RECOVERY SYSTEMS MARKET, BY REGION, 2021-2030 (USD BILLION)
TABLE 38. SPAIN AUTOMOTIVE ENERGY RECOVERY SYSTEMS MARKET, BY PRODUCT TYPE, 2021-2030 (USD BILLION)
TABLE 39. SPAIN AUTOMOTIVE ENERGY RECOVERY SYSTEMS MARKET, BY VEHICLE TYPE, 2021-2030 (USD BILLION)
TABLE 40. SPAIN AUTOMOTIVE ENERGY RECOVERY SYSTEMS MARKET, BY REGION, 2021-2030 (USD BILLION)
TABLE 41. ROE AUTOMOTIVE ENERGY RECOVERY SYSTEMS MARKET, BY PRODUCT TYPE, 2021-2030 (USD BILLION)
TABLE 42. ROE AUTOMOTIVE ENERGY RECOVERY SYSTEMS MARKET, BY VEHICLE TYPE, 2021-2030 (USD BILLION)
TABLE 43. ROE AUTOMOTIVE ENERGY RECOVERY SYSTEMS MARKET, BY REGION, 2021-2030 (USD BILLION)
TABLE 44. ASIA PACIFIC AUTOMOTIVE ENERGY RECOVERY SYSTEMS MARKET, BY COUNTRY, 2021-2030 (USD BILLION)
TABLE 45. ASIA PACIFIC AUTOMOTIVE ENERGY RECOVERY SYSTEMS MARKET, BY PRODUCT TYPE, 2021-2030 (USD BILLION)
TABLE 46. ASIA PACIFIC AUTOMOTIVE ENERGY RECOVERY SYSTEMS MARKET, BY VEHICLE TYPE, 2021-2030 (USD BILLION)
TABLE 47. ASIA PACIFIC AUTOMOTIVE ENERGY RECOVERY SYSTEMS MARKET, BY REGION, 2021-2030 (USD BILLION)
TABLE 48. CHINA AUTOMOTIVE ENERGY RECOVERY SYSTEMS MARKET, BY PRODUCT TYPE, 2021-2030 (USD BILLION)
TABLE 49. CHINA AUTOMOTIVE ENERGY RECOVERY SYSTEMS MARKET, BY VEHICLE TYPE, 2021-2030 (USD BILLION)
TABLE 50. CHINA AUTOMOTIVE ENERGY RECOVERY SYSTEMS MARKET, BY REGION, 2021-2030 (USD BILLION)
TABLE 51. INDIA AUTOMOTIVE ENERGY RECOVERY SYSTEMS MARKET, BY PRODUCT TYPE, 2021-2030 (USD BILLION)
TABLE 52. INDIA AUTOMOTIVE ENERGY RECOVERY SYSTEMS MARKET, BY VEHICLE TYPE, 2021-2030 (USD BILLION)
TABLE 53. INDIA AUTOMOTIVE ENERGY RECOVERY SYSTEMS MARKET, BY REGION, 2021-2030 (USD BILLION)
TABLE 54. JAPAN AUTOMOTIVE ENERGY RECOVERY SYSTEMS MARKET, BY PRODUCT TYPE, 2021-2030 (USD BILLION)
TABLE 55. JAPAN AUTOMOTIVE ENERGY RECOVERY SYSTEMS MARKET, BY VEHICLE TYPE, 2021-2030 (USD BILLION)
TABLE 56. JAPAN AUTOMOTIVE ENERGY RECOVERY SYSTEMS MARKET, BY REGION, 2021-2030 (USD BILLION)
TABLE 57. REST OF APAC AUTOMOTIVE ENERGY RECOVERY SYSTEMS MARKET, BY PRODUCT TYPE, 2021-2030 (USD BILLION)
TABLE 58. REST OF APAC AUTOMOTIVE ENERGY RECOVERY SYSTEMS MARKET, BY VEHICLE TYPE, 2021-2030 (USD BILLION)
TABLE 59. REST OF APAC AUTOMOTIVE ENERGY RECOVERY SYSTEMS MARKET, BY REGION, 2021-2030 (USD BILLION)
TABLE 60. LATIN AMERICA AUTOMOTIVE ENERGY RECOVERY SYSTEMS MARKET, BY PRODUCT TYPE, 2021-2030 (USD BILLION)
TABLE 61. LATIN AMERICA AUTOMOTIVE ENERGY RECOVERY SYSTEMS MARKET, BY VEHICLE TYPE, 2021-2030 (USD BILLION)
TABLE 62. LATIN AMERICA AUTOMOTIVE ENERGY RECOVERY SYSTEMS MARKET, BY REGION, 2021-2030 (USD BILLION)
TABLE 63. BRAZIL AUTOMOTIVE ENERGY RECOVERY SYSTEMS MARKET, BY PRODUCT TYPE, 2021-2030 (USD BILLION)
TABLE 64. BRAZIL AUTOMOTIVE ENERGY RECOVERY SYSTEMS MARKET, BY VEHICLE TYPE, 2021-2030 (USD BILLION)
TABLE 65. BRAZIL AUTOMOTIVE ENERGY RECOVERY SYSTEMS MARKET, BY REGION, 2021-2030 (USD BILLION)
TABLE 66. ARGENTINA AUTOMOTIVE ENERGY RECOVERY SYSTEMS MARKET, BY PRODUCT TYPE, 2021-2030 (USD BILLION)
TABLE 67. ARGENTINA AUTOMOTIVE ENERGY RECOVERY SYSTEMS MARKET, BY VEHICLE TYPE, 2021-2030 (USD BILLION)
TABLE 68. ARGENTINA AUTOMOTIVE ENERGY RECOVERY SYSTEMS MARKET, BY REGION, 2021-2030 (USD BILLION)
TABLE 69. MIDDLE EAST AND AFRICA AUTOMOTIVE ENERGY RECOVERY SYSTEMS MARKET, BY PRODUCT TYPE, 2021-2030 (USD BILLION)
TABLE 70. MIDDLE EAST AND AFRICA AUTOMOTIVE ENERGY RECOVERY SYSTEMS MARKET, BY VEHICLE TYPE, 2021-2030 (USD BILLION)
TABLE 71. MIDDLE EAST AND AFRICA AUTOMOTIVE ENERGY RECOVERY SYSTEMS MARKET, BY REGION, 2021-2030 (USD BILLION)
TABLE 72. SAUDI ARABIA AUTOMOTIVE ENERGY RECOVERY SYSTEMS MARKET, BY PRODUCT TYPE, 2021-2030 (USD BILLION)
TABLE 73. SAUDI ARABIA AUTOMOTIVE ENERGY RECOVERY SYSTEMS MARKET, BY VEHICLE TYPE, 2021-2030 (USD BILLION)
TABLE 74. SAUDI ARABIA AUTOMOTIVE ENERGY RECOVERY SYSTEMS MARKET, BY REGION, 2021-2030 (USD BILLION)
TABLE 75. UAE AUTOMOTIVE ENERGY RECOVERY SYSTEMS MARKET, BY PRODUCT TYPE, 2021-2030 (USD BILLION)
TABLE 76. UAE AUTOMOTIVE ENERGY RECOVERY SYSTEMS MARKET, BY VEHICLE TYPE, 2021-2030 (USD BILLION)
TABLE 77. UAE AUTOMOTIVE ENERGY RECOVERY SYSTEMS MARKET, BY REGION, 2021-2030 (USD BILLION)
TABLE 78. REST OF MIDDLE EAST AND AFRICA AUTOMOTIVE ENERGY RECOVERY SYSTEMS MARKET, BY PRODUCT TYPE, 2021-2030 (USD BILLION)
TABLE 79. REST OF MIDDLE EAST AND AFRICA AUTOMOTIVE ENERGY RECOVERY SYSTEMS MARKET, BY VEHICLE TYPE, 2021-2030 (USD BILLION)
TABLE 80. REST OF MIDDLE EAST AND AFRICA AUTOMOTIVE ENERGY RECOVERY SYSTEMS MARKET, BY REGION, 2021-2030 (USD BILLION)
TABLE 81. BMW AG: FINANCIALS
TABLE 82. BMW AG: PRODUCTS & SERVICES
TABLE 83. BMW AG: RECENT DEVELOPMENTS
TABLE 84. ROBERT BOSCH GMBH: FINANCIALS
TABLE 85. ROBERT BOSCH GMBH: PRODUCTS & SERVICES
TABLE 86. ROBERT BOSCH GMBH: RECENT DEVELOPMENTS
TABLE 87. CONTINENTAL AG: FINANCIALS
TABLE 88. CONTINENTAL AG: PRODUCTS & SERVICES
TABLE 89. CONTINENTAL AG: RECENT DEVELOPMENTS
TABLE 90. DENSO CORPORATION: FINANCIALS
TABLE 91. DENSO CORPORATION: PRODUCTS & SERVICES
TABLE 92. DENSO CORPORATION: RECENT DEVELOPMENTS
TABLE 93. TENNECO: FINANCIALS
TABLE 94. TENNECO: PRODUCTS & SERVICES
TABLE 95. TENNECO: RECENT DEVELOPMENTS
TABLE 96. GENTHERM: FINANCIALS
TABLE 97. GENTHERM: PRODUCTS & SERVICES
TABLE 98. GENTHERM: RECENT DEVELOPMENTS
TABLE 99. VISTEON CORPORATION: FINANCIALS
TABLE 100. VISTEON CORPORATION: PRODUCTS & SERVICES
TABLE 101. VISTEON CORPORATION: RECENT DEVELOPMENTS
TABLE 102. DAIMLER: FINANCIALS
TABLE 103. DAIMLER: PRODUCTS & SERVICES
TABLE 104. DAIMLER: RECENT DEVELOPMENTS
TABLE 105. VOLKSWAGEN: FINANCIALS
TABLE 106. VOLKSWAGEN: PRODUCTS & SERVICES
TABLE 107. VOLKSWAGEN: RECENT DEVELOPMENTS
TABLE 108. GENERAL MOTORS COMPANY: FINANCIALS
TABLE 109. GENERAL MOTORS COMPANY: PRODUCTS & SERVICES
TABLE 109. GENERAL MOTORS COMPANY: RECENT DEVELOPMENTS


