The market for bioethanol was assessed at USD 35.0 billion in 2021, and it is anticipated to expand at a CAGR of 15.0% over the following five years. Bioethanol has found wide usage as a fuel and fuel additive by the transportation and automotive industry. The demand for transportation fuel is expected to witness a significant increase due to the decrease in fossil fuel reserves and an increase in the number of automobiles. Bioethanol is also a key element for transportation in government policies of various countries across the globe. Additionally, bioethanol when mixed with emulsifiers, is used as a fuel for modified diesel engines. This is generally used for greenhouse gas savings in heavy vehicles and buses in metropolis cities. These factors are expected to support market growth during the forecast period.
Research Methodology:
For both qualitative market assessments and market segmentation, the organisation primarily uses top-down and bottom-up methodologies. We take pride in our knowledge of how to effectively use data triangulation to examine the market from the three main angles of primary data mining, specialised statistical model and framework, and primary source data validation.
We carefully choose our original raw market data for analysis from a vast pool of information gathered in our repository, analyst evaluations, news announcements, whitepapers, and other reputable paid databases. In-depth surveys and trade publications are used to collaborate on technical facts and trends. The dynamics of the industry and pricing trends are assessed from reliable sources.
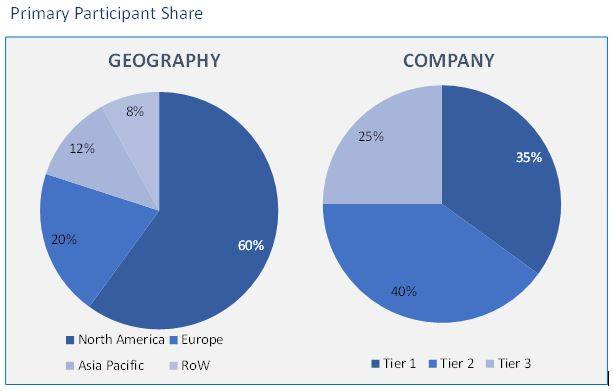
We use specific data simulation models to generate our market projections and estimations. These versatile and adaptable models are developed and tailored to match the unique needs of each investigation. Our market forecasting and estimation are primarily done collaboratively using a combination of technology analysis, economic tools, domain knowledge, and economic instruments. Our preferred method for generating global market estimations and calculating predicted market growth is typically a bottom-up strategy.The primary participants share is given below:
Bioethanol Market based on Feedstock:
- Cereals & Starch
- Wheat
- Maize
- Beet
- Sugarcane
- Others
Bioethanol Market based on End use Industry:
- Food & Beverages
- Power Generation
- Transportation
- Industrial
- Medical
- Others
Bioethanol Market based on Geography:
- North America (U.S., Canada)
- Europe (France, Germany, UK, Italy, Netherlands, Spain, Russia)
- Asia Pacific (Japan, China, India, Malaysia, Indonesia. South Korea)
- Latin America (Brazil, Mexico, Argentina)
- Middle East & Africa (Saudi Arabia, UAE, Israel, South Africa)
A transparent, colourless liquid called bioethanol is regarded as a green fuel because it is biodegradable. It is made by fermenting plant materials including corn, sugarcane, and lignocellulosic biomass that contain starch and sugar. In the automobile sector, bioethanol is largely utilised as an octane enhancer to lower engine knocking.
The bioethanol market is divided into categories based on the type of feedstock used (such as sugarcane, corn, wheat, and other feedstock types), the application used (such as automotive and transportation, food and beverage, pharmaceutical, cosmetics and personal care, and other applications), and the region used (such as Asia-Pacific, North America, Europe, South America, and Middle-East and Africa). For each of the aforementioned market segments, the study provides market size and projections in volume (million litres).
The automobile and transportation industries use bioethanol the most for fuel and fuel additives. To refuel petrol engines in road cars, it is used in addition to normal petrol. Additionally, it is capable of producing ETBE, an octane enhancer found in many different types of petrol.
The renewability of bioethanol is increased by blending it with conventional fuels. E10 energy gets its name from the 10% ethanol it contains. A low-carbon fuel like bioethanol could aid in the decarbonization of the transportation sector.
Over the past three decades, financial incentives have been given to petrol marketers in the US for using bio-ethanol as an octane booster and gas extender. This has encouraged increased use of bio-ethanol in this industry.
The most recent law, which includes money and crucial tax credits for manufacturing low-carbon fuels, gave biofuel producers in the United States a boost. A budget of USD 500 million was set aside for the installation of storage tanks and associated machinery for ethanol-biodiesel blends in order to develop the infrastructure for biofuels.
The bioethanol market share is dominated by the North American continent. Globally, the United States produces the most bioethanol, followed by Canada, Brazil, China, and India. Additionally, it consumes the most bioethanol. Due to greater renewable fuel standard (RFS) objectives and rising domestic motor petrol consumption, practically all of which is now mixed with 10% ethanol by volume, bioethanol output expanded in recent years.
Some of the major market players in the bioethanol market are Abengoa Bioenergy, Archer Daniels Midland, Bioethanol Japan Kansai Co Ltd, BlueFire Ethanol Fuels Inc., Cremer Oleo GmbH & Co., CropEnergies AG, Green Future Innovations Inc., Green Plains, Nordzucker AG, Petrobras Biocombustíveis, Raizen Energia, Royal Dutch Shell PLC, Soufflet Group, Tereos, and Valero Energy Corporation. These players are expanding their presence across various geographies and entering new markets in developing regions to expand their customer base and strengthen their presence in the market. The companies are also introducing new innovative products to cater to the growing consumer demands.
- This report illustrates the most vital attributes of the bioethanol market, which are driving and providing opportunities.
- This research gives an in-depth analysis of the bioethanol market growth on the basis of several segments in the market.
- This report presents the predictions of the past and present trends of the bioethanol market.
- This study also presents the competitive analysis, such as key strategies and capabilities of major players of the bioethanol market.
List of Tables
TABLE 1. BIOETHANOL MARKET VALUE, BY FEEDSTOCK, 2021-2030 (USD BILLION)
TABLE 2. BIOETHANOL MARKET VALUE FOR CEREALS AND STARCH, BY GEOGRAPHY, 2021-2030 (USD BILLION)
TABLE 3. BIOETHANOL MARKET VALUE FOR WHEAT, BY GEOGRAPHY, 2021-2030 (USD BILLION)
TABLE 4. BIOETHANOL MARKET VALUE FOR MAIZE, BY GEOGRAPHY, 2021-2030 (USD BILLION)
TABLE 5. BIOETHANOL MARKET VALUE FOR OTHERS, BY GEOGRAPHY, 2021-2030 (USD BILLION)
TABLE 6. BIOETHANOL MARKET VALUE, BY END-USE INDUSTRY, 2021-2030 (USD BILLION)
TABLE 7. BIOETHANOL MARKET VALUE FOR FOOD AND BREVERAGES, 2021-2030 (USD BILLION)
TABLE 8. BIOETHANOL MARKET VALUE FOR POWER GENERATION, BY GEOGRAPHY, 2021-2030 (USD BILLION)
TABLE 9. BIOETHANOL MARKET VALUE FOR TRANSPORTATION, BY GEOGRAPHY, 2021-2030 (USD BILLION)
TABLE 10. BIOETHANOL MARKET VALUE FOR MEDICAL, BY GEOGRAPHY, 2021-2030 (USD BILLION)
TABLE 11. BIOETHANOL MARKET VALUE FOR OTHERS, BY GEOGRAPHY, 2021-2030 (USD BILLION)
TABLE 12. NORTH AMERICA BIOETHANOL MARKET VALUE, BY COUNTRY, 2021-2030 (USD BILLION)
TABLE 13. NORTH AMERICA BIOETHANOL MARKET VALUE, BY FEEDSTOCK, 2021-2030 (USD BILLION)
TABLE 14. NORTH AMERICA BIOETHANOL MARKET VALUE, BY FUEL BLEND, 2021-2030 (USD BILLION)
TABLE 15. NORTH AMERICA BIOETHANOL MARKET VALUE, BY END-USER, 2021-2030 (USD BILLION)
TABLE 16. U.S BIOETHANOL MARKET VALUE, BY FEEDSTOCK, 2021-2030 (USD BILLION)
TABLE 17. U.S BIOETHANOL MARKET VALUE, BY FUEL BLEND, 2021-2030 (USD BILLION)
TABLE 18. U.S BIOETHANOL MARKET VALUE, BY END-USER, 2021-2030 (USD BILLION)
TABLE 19. CANADA BIOETHANOL MARKET VALUE, BY FEEDSTOCK, 2021-2030 (USD BILLION)
TABLE 20. CANADA BIOETHANOL MARKET VALUE, BY FUEL BLEND, 2021-2030 (USD BILLION)
TABLE 21. CANADA BIOETHANOL MARKET VALUE, BY END-USER, 2021-2030 (USD BILLION)
TABLE 22. MEXICO BIOETHANOL MARKET VALUE, BY FEEDSTOCK, 2021-2030 (USD BILLION)
TABLE 23. MEXICO BIOETHANOL MARKET VALUE, BY FUEL BLEND, 2021-2030 (USD BILLION)
TABLE 24. MEXICO BIOETHANOL MARKET VALUE, BY END-USER, 2021-2030 (USD BILLION)
TABLE 25. EUROPE BIOETHANOL MARKET VALUE, BY COUNTRY, 2021-2030 (USD BILLION)
TABLE 26. EUROPE BIOETHANOL MARKET VALUE, BY FEEDSTOCK, 2021-2030 (USD BILLION)
TABLE 27. EUROPE BIOETHANOL MARKET VALUE, BY FUEL BLEND, 2021-2030 (USD BILLION)
TABLE 28. EUROPE BIOETHANOL MARKET VALUE, END-USER, 2021-2030 (USD BILLION)
TABLE 29. GERMANY BIOETHANOL MARKET VALUE, BY FEEDSTOCK, 2021-2030 (USD BILLION)
TABLE 30. GERMANY BIOETHANOL MARKET VALUE, BY FUEL BLEND, 2021-2030 (USD BILLION)
TABLE 31. GERMANY BIOETHANOL MARKET VALUE, BY END-USER, 2021-2030 (USD BILLION)
TABLE 32. U.K BIOETHANOL MARKET VALUE, BY FEEDSTOCK, 2021-2030 (USD BILLION)
TABLE 33. U.K BIOETHANOL MARKET VALUE, BY FUEL BLEND, 2021-2030 (USD BILLION)
TABLE 34. U.K BIOETHANOL MARKET VALUE, BY END-USER, 2021-2030 (USD BILLION)
TABLE 35. FRANCE BIOETHANOL MARKET VALUE, BY FEEDSTOCK, 2021-2030 (USD BILLION)
TABLE 36. FRANCE BIOETHANOL MARKET VALUE, BY FUEL BLEND, 2021-2030 (USD BILLION)
TABLE 37. FRANCE BIOETHANOL MARKET VALUE, BY END-USER, 2021-2030 (USD BILLION)
TABLE 38. ITALY BIOETHANOL MARKET VALUE, BY FEEDSTOCK, 2021-2030 (USD BILLION)
TABLE 39. ITALY BIOETHANOL MARKET VALUE, BY FUEL BLEND, 2021-2030 (USD BILLION)
TABLE 40. ITALY BIOETHANOL MARKET VALUE, BY END-USER, 2021-2030 (USD BILLION)
TABLE 41. SPAIN BIOETHANOL MARKET VALUE, BY FEEDSTOCK, 2021-2030 (USD BILLION)
TABLE 42. SPAIN BIOETHANOL MARKET VALUE, BY FUEL BLEND, 2021-2030 (USD BILLION)
TABLE 43. SPAIN BIOETHANOL MARKET VALUE, BY END-USER, 2021-2030 (USD BILLION)
TABLE 44. ROE BIOETHANOL MARKET VALUE, BY FEEDSTOCK, 2021-2030 (USD BILLION)
TABLE 45. ROE BIOETHANOL MARKET VALUE, BY FUEL BLEND, 2021-2030 (USD BILLION)
TABLE 46. ROE BIOETHANOL MARKET VALUE, BY END-USER, 2021-2030 (USD BILLION)
TABLE 47. ASIA PACIFIC BIOETHANOL MARKET VALUE, BY COUNTRY, 2021-2030 (USD BILLION)
TABLE 48. ASIA PACIFIC BIOETHANOL MARKET VALUE, BY FEEDSTOCK, 2021-2030 (USD BILLION)
TABLE 49. ASIA PACIFIC BIOETHANOL MARKET VALUE, BY FUEL BLEND, 2021-2030 (USD BILLION)
TABLE 50. ASIA PACIFIC BIOETHANOL MARKET VALUE, BY END-USER, 2021-2030 (USD BILLION)
TABLE 51. CHINA BIOETHANOL MARKET VALUE, BY FEEDSTOCK, 2021-2030 (USD BILLION)
TABLE 52. CHINA BIOETHANOL MARKET VALUE, BY FUEL BLEND, 2021-2030 (USD BILLION)
TABLE 53. CHINA BIOETHANOL MARKET VALUE, BY END-USER, 2021-2030 (USD BILLION)
TABLE 54. INDIA BIOETHANOL MARKET VALUE, BY FEEDSTOCK, 2021-2030 (USD BILLION)
TABLE 55. INDIA BIOETHANOL MARKET VALUE, BY FUEL BLEND, 2021-2030 (USD BILLION)
TABLE 56. INDIA BIOETHANOL MARKET VALUE, BY END-USER, 2021-2030 (USD BILLION)
TABLE 57. JAPAN BIOETHANOL MARKET VALUE, BY FEEDSTOCK, 2021-2030 (USD BILLION)
TABLE 58. JAPAN BIOETHANOL MARKET VALUE, BY FUEL BLEND, 2021-2030 (USD BILLION)
TABLE 59. JAPAN BIOETHANOL MARKET VALUE, BY END-USER, 2021-2030 (USD BILLION)
TABLE 60. REST OF APAC BIOETHANOL MARKET VALUE, BY FEEDSTOCK, 2021-2030 (USD BILLION)
TABLE 61. REST OF APAC BIOETHANOL MARKET VALUE, BY FUEL BLEND, 2021-2030 (USD BILLION)
TABLE 62. REST OF APAC BIOETHANOL MARKET VALUE, BY END-USER, 2021-2030 (USD BILLION)
TABLE 63. LATIN AMERICA BIOETHANOL MARKET VALUE, BY FEEDSTOCK, 2021-2030 (USD BILLION)
TABLE 64. LATIN AMERICA BIOETHANOL MARKET VALUE, BY FUEL BLEND, 2021-2030 (USD BILLION)
TABLE 65. LATIN AMERICA BIOETHANOL MARKET VALUE, BY END-USER, 2021-2030 (USD BILLION)
TABLE 66. BRAZIL BIOETHANOL MARKET VALUE, BY FEEDSTOCK, 2021-2030 (USD BILLION)
TABLE 67. BRAZIL BIOETHANOL MARKET VALUE, BY FUEL BLEND, 2021-2030 (USD BILLION)
TABLE 68. BRAZIL BIOETHANOL MARKET VALUE, BY END-USER, 2021-2030 (USD BILLION)
TABLE 69. ARGENTINA BIOETHANOL MARKET VALUE, BY FEEDSTOCK, 2021-2030 (USD BILLION)
TABLE 70. ARGENTINA BIOETHANOL MARKET VALUE, BY FUEL BLEND, 2021-2030 (USD BILLION)
TABLE 71. ARGENTINA BIOETHANOL MARKET VALUE, BY END-USER, 2021-2030 (USD BILLION)
TABLE 72. MIDDLE EAST AND AFRICA BIOETHANOL MARKET VALUE, BY FEEDSTOCK, 2021-2030 (USD BILLION)
TABLE 73. MIDDLE EAST AND AFRICA BIOETHANOL MARKET VALUE, BY FUEL BLEND, 2021-2030 (USD BILLION)
TABLE 74. MIDDLE EAST AND AFRICA BIOETHANOL MARKET VALUE, BY END-USER, 2021-2030 (USD BILLION)
TABLE 75. SAUDI ARABIA BIOETHANOL MARKET VALUE, BY FEEDSTOCK, 2021-2030 (USD BILLION)
TABLE 76. SAUDI ARABIA BIOETHANOL MARKET VALUE, BY FUEL BLEND, 2021-2030 (USD BILLION)
TABLE 77. SAUDI ARABIA BIOETHANOL MARKET VALUE, BY END-USER, 2021-2030 (USD BILLION)
TABLE 78. UAE BIOETHANOL MARKET VALUE, BY FEEDSTOCK, 2021-2030 (USD BILLION)
TABLE 79. UAE BIOETHANOL MARKET VALUE, BY FUEL BLEND, 2021-2030 (USD BILLION)
TABLE 80. UAE BIOETHANOL MARKET VALUE, BY END-USER, 2021-2030 (USD BILLION)
TABLE 81. REST OF MIDDLE EAST AND AFRICA BIOETHANOL MARKET VALUE, BY FEEDSTOCK, 2021-2030 (USD BILLION)
TABLE 82. REST OF MIDDLE EAST AND AFRICA BIOETHANOL MARKET VALUE, BY FUEL BLEND, 2021-2030 (USD BILLION)
TABLE 83. REST OF MIDDLE EAST AND AFRICA BIOETHANOL MARKET VALUE, BY END-USER, 2021-2030 (USD BILLION)
TABLE 84. ABENGOA BIOENERGY: FINANCIALS
TABLE 85. ABENGOA BIOENERGY: PRODUCTS & SERVICES
TABLE 86. ABENGOA BIOENERGY: RECENT DEVELOPMENTS
TABLE 87. ARCHER DANIELS MIDLAND: FINANCIALS
TABLE 88. ARCHER DANIELS MIDLAND: PRODUCTS & SERVICES
TABLE 89. ARCHER DANIELS MIDLAND: RECENT DEVELOPMENTS
TABLE 90. BIOETHANOL JAPAN KANSAI CO LTD: FINANCIALS
TABLE 91. BIOETHANOL JAPAN KANSAI CO LTD: PRODUCTS & SERVICES
TABLE 92. BIOETHANOL JAPAN KANSAI CO LTD: RECENT DEVELOPMENTS
TABLE 93. BLUEFIRE ETHANOL FUELS INC.: FINANCIALS
TABLE 94. BLUEFIRE ETHANOL FUELS INC.: PRODUCTS & SERVICES
TABLE 95. BLUEFIRE ETHANOL FUELS INC.: RECENT DEVELOPMENTS
TABLE 96. CREMER OLEO GMBH & CO.: FINANCIALS
TABLE 97. CREMER OLEO GMBH & CO.: PRODUCTS & SERVICES
TABLE 98. CREMER OLEO GMBH & CO.: RECENT DEVELOPMENTS
TABLE 99. CROPENERGIES AG: FINANCIALS
TABLE 100. CROPENERGIES AG: PRODUCTS & SERVICES
TABLE 101. CROPENERGIES AG: RECENT DEVELOPMENTS
TABLE 102. GREEN FUTURE INNOVATIONS INC.: FINANCIALS
TABLE 103. GREEN FUTURE INNOVATIONS INC.: PRODUCTS & SERVICES
TABLE 104. GREEN FUTURE INNOVATIONS INC.: RECENT DEVELOPMENTS
TABLE 105. GREEN PLAINS: FINANCIALS
TABLE 106. GREEN PLAINS: PRODUCTS & SERVICES
TABLE 107. GREEN PLAINS: RECENT DEVELOPMENTS
TABLE 108. NORDZUCKER AG: FINANCIALS
TABLE 109. NORDZUCKER AG: PRODUCTS & SERVICES
TABLE 110. NORDZUCKER AG: RECENT DEVELOPMENTS
TABLE 111. PETROBRAS BIOCOMBUSTÍVEIS: FINANCIALS
TABLE 112. PETROBRAS BIOCOMBUSTÍVEIS: PRODUCTS & SERVICES
TABLE 113. PETROBRAS BIOCOMBUSTÍVEIS: RECENT DEVELOPMENTS


