

Advanced carbon fibre composites, such as Carbon Fibre Reinforced Thermoplastic (CFRTP), are constantly being improved, and their increasing use in high-volume automobiles will spur industry expansion. With mass manufacturing techniques, the improved CFRTP can be moulded in about a minute and is around 40% lighter and 10 times more impact resistant than steel. In order to create cutting-edge materials that can be employed in high volume production cars, the automotive industry is actively investing in research and development. With a moulding time of roughly one minute, the box design was designed collaboratively by GM and Teijin Limited, which boosts manufacturing speeds.
Carbon atoms having a diameter of five to ten micrometres are used to create carbon fibre. It also goes by the name graphite fibre. These fibres have stronger chemical resistance, higher strength-to-weight ratio, lower thermal expansion, higher tensile strength, and higher high-temperature tolerance. These characteristics of the carbon-based fibres make them the material of choice for applications in the fields of aerospace, automotive, defence, building, wind turbines, and sports. The demand for lightweight vehicles and automobiles is expected to expand, which would propel the market for carbon fibre. Key elements influencing the market outlook include the demand for fuel-efficient automobiles and stringent regulatory rules addressing carbon emissions.
Projects are being carried out to turn coal tar, a by-product of the coke process for the steel industry, into carbon fibre and composites by industrial partners and researchers. With applications in low-weight, high-stiffness composites, this novel product has the potential to raise the value of coal tar pitch by five to 55 times that which it already possesses.
The University of Kentucky Centre for Applied Energy Research (CAER) and the U.S. Department of Energy’s (DOE) Oak Ridge National Laboratory (ORNL) engaged into a strategic agreement in December 2020 for approximately USD 10 million projects, which mostly convert coal into CFs and composite. The research will primarily outline significant issues with regard to different types of coal feedstock, coal processing, and CF manufacturing them. The main objective of CAERs is to produce CF and composites from various kinds of coal fuel. The task of ORNL will be to correlate the molecular make-up of coal. Such innovations will hasten the production of inexpensive carbon fibre, driving the market’s broadening.
Research Methodology:
The Two main tasks are included in the study’s estimation of the carbon fibre market’s present size. To gather details about the market, its competitors, and its parent market, extensive secondary research was conducted. The following phase involved conducting primary research to confirm these conclusions, presumptions, and estimates with industry professionals across the value chain. The top-down and bottom-up methodologies were both used to calculate the size of the entire market. The size of market segments and sub-segments was then determined using market breakdown and data triangulation processes.The primary participants share is given below: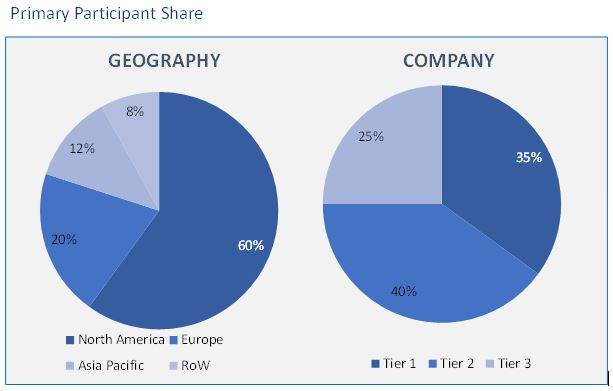
Carbon Fiber Composite Market based on Precursor:
- PAN–based carbon fibre
- Pitch–based carbon fibre
- Rayon–based carbon fibre
Carbon Fiber Composite Market based on Tow:
- Large Tow
- Small Tow
Carbon Fiber Composite Market based on Application:
- Aviation, Aerospace & Defense
- Automotive
- Wind Turbines
- Sports & Leisure
- Construction
- Others
Carbon Fiber Composite Market based on Geography:
- North America
- US
- Canada
- Europe
- Germany
- UK
- France
- Italy
- Spain
- Rest of Europe (RoE)
- Asia Pacific (APAC)
- China
- Japan
- India
- Australia
- South Korea
- Rest of Asia Pacific (RoAPAC)
- Latin America (LATAM)
- Brazil
- Argentina
- Rest of South America
- Middle East and Africa (MEA)
- UAE
- Turkey
- Saudi Arabia
- South Africa
- Rest of Middle East & Africa
Due to its high performance and lightweight characteristics, carbon composites are frequently utilised in the aerospace, automotive, construction, oil & gas, and wind energy industries. The cost of making carbon fibre contributes to the product’s overall price increase. The high cost of the product prevents carbon composites from being widely used in a variety of industries. The yield and price of the precursor used to make CF have a direct impact on its price. Currently, PAN-based carbon fibres have a conversion efficiency of just fifty percent and cost an average of US$ 21.8 per kg for non-aerospace grade materials. Because local and small-scale producers find it challenging to enter the market due to these high pricing, market expansion is constrained.
The market is divided into PAN (polyacrylonitrile) and pitch depending on the precursor. Due to rising demand from end-use industries, the PAN segment, which accounted for a sizeable portion of the market in 2022, is predicted to take the lead in the coming years. The PAN-based graphite fibre is in increased demand due to its characteristics, such as its low cost, high modulus, high tensile strength, and superior fibre quality. It is projected that rising product demand for automotive, sporting goods, and aerospace & defence applications would further boost the segment’s share.
During the forecast period, the pitch-based segment may have a considerable growth rate. It is suitable for the sports and aircraft sectors because to characteristics like low electrical resistivity, low negative coefficient, high thermal conductivity, and high modulus.
On the basis of towing, the market is segmented into small towing and large towing. In 2022, the small tow segment had the largest share. Small tow fibers refer to wandering with 24,000 filaments or less. They are widely used in the aerospace and defense industries due to their high modulus and tensile strength.
Large tow fibres are defined as having 48,000 to 320,000 carbon filaments or more. A sizeable portion of the market was also occupied by large tow fibres; this share is expected to grow in the near future as businesses formulate plans to create large-tow intermediates. As an illustration, in November 2017, Solvay purchased European Carbon Fibre GmbH (ECF), a manufacturer of large-tow PAN fibre with headquarters in Germany. With this acquisition, Solvay will be able to expand its selection of PAN and pitch aerospace-grade fibres and create a portfolio of large-tow fibres.
The market is divided into aviation, aerospace & defence, automotive, wind turbines, sports & recreation, construction, and others based on application. The aviation, aerospace, and defence industry held the largest market share among these applications in 2022, and it’s possible that it will maintain that position for the foreseeable future. Interior components, engine blades, propellers/rotors, brackets, single-aisle wings, and wide-body wings are all made of composite materials in the aircraft sector. In addition, aerospace engineers are attempting to increase the safety and sustainability of flying, which has resulted in the usage of fibre composite materials in space shuttles, planes, and helicopters. As a result, increasing aircraft production is projected to fuel market expansion. About 40% of contemporary aircraft are made of composite materials. For instance, the Boeing 787 Dreamliner passenger airliner has around 50% by weight of composite material, primarily sandwiched or laminated carbon fibre. The fuselage, wings, tail, and main body of the aircraft are all made of fibre materials. According to Boeing, the use of carbon and other composite materials, which do not corrode, allows for less maintenance.
The product is becoming more well-known in the sporting world. The market for sports & leisure applications will rise as high-performance and lightweight materials are increasingly used in sporting goods. Major tennis players can hit the ball faster because to the materials used to create lighter, specially designed rackets. Carbon composite lightens the weight of the bicycle in high-performance cycling, enhancing lap times.
The Asia Pacific market is anticipated to grow quickly during the anticipated period. Rapid urbanisation and rising government spending on infrastructure projects are both contributing factors to this increase in the area. Market expansion will be fueled by the expanding usage of construction composites in China and India while constructing homes, bridges, and tunnels. A significant market opportunity for product adoption in the construction industry has been established by the existence of top construction businesses throughout Asia and the Pacific. The need for products in the region is also being driven by the growing investment in the aviation, aerospace, defence, and renewable energy sectors.
- This report illustrates the most vital attributes of the Carbon fibre composite market, which are driving and providing opportunities.
- This research gives an in-depth analysis of the Carbon fibre composite market growth on the basis of several segments in the market.
- This report presents the predictions of the past and present trends of the Carbon fibre composite market.
- This study also presents the competitive analysis, such as key strategies and capabilities of major players of the Carbon fibre composite market.
