

A driving simulator is a piece of technology that simulates a driving environment to teach drivers. It serves both recreational and educational purposes. By providing the driver with the appropriate training, it helps to improve the driving conditions. The simulator’s sensors keep an eye on the driver’s attention, situation-handling ability, and demeanour while driving. The fitted sensors also provide information that is further evaluated and aids in the creation of driver assistance systems. Additionally, driving simulator use is now required in driving schools. To obtain a driving licence, a learner must complete a predetermined number of hours on the simulator, pass the simulator exam, practise driving on a real vehicle on the road and pass a driving test.
Since it is not always possible to recreate real-world scenarios that a driver might encounter on the road during routine practise, these simulator exercises have been useful in instructing drivers. As a result, it is anticipated to stimulate the expansion of the driving simulator industry.
As automotive technology advance daily, there is a growing demand for safety features in them. The majority of collisions are caused by human mistake, poor driving, etc. Driving simulators, which artificially simulate a real-time environment, are the best way to improve driving skills digitally in order to prevent such situations. The driver can better control the situation with the aid of this system. Consequently, a driving simulator is more effective and greatly increases safety.
In order to test and analyse product designs in a virtual environment, driving simulators and analysis technology are being more widely used in the railways, aircraft, marine, defence, and automotive industries. Since most nations are enacting new legislation to boost vehicular safety, there is a constant rise in demand for improved safety features in compact and mid-sized cars, particularly in the automotive industry. Additionally, the increasingly strict environmental and safety laws have forced authorities and manufacturers to invest in cutting-edge driving simulators for training. As a result, the price of developing a new vehicle’s cutting-edge features is significantly reduced.
Research Methodology:
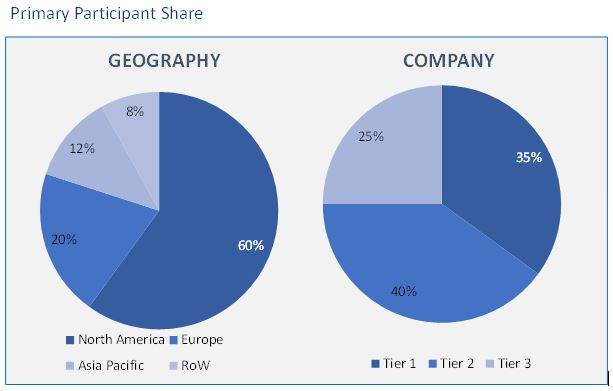
To provide accurate data insights, we employ the most recent research methodologies. Our professionals provide the top study papers with suggestions for producing income. Both top-down and bottom-up research techniques are used by analysts to do thorough study. This facilitates investigating the market from many angles. This further aids market analysts in dividing up the many market segments for individual analysis. One of the key components in the development and testing of new vehicles is the use of simulators. By performing virtual simulations while creating the prototype and testing the vehicle on the track, the simulator’s output aids engineers in making crucial decisions. The introduction of autonomous and semi-autonomous vehicles, the electrification of automotive components, and the growing impact of technology companies in the automotive sector are further growth drivers for the market for driving simulators. Autonomous vehicles are the future of the automobile industry. The primary participants share is given below:
Driving Simulator Market based on Simulator Type:
- Compact
- Full-scale
- Advanced
Driving Simulator Market based on Application:
- Research & Testing
- Training
- Motor Sports & Gaming
Driving Simulator Market based on End use:
- Automotive
- Marine
- Aviation
Driving Simulator Market based on Geography:
- North America
- US
- Canada
- Europe
- Germany
- UK
- France
- Italy
- Spain
- Rest of Europe (RoE)
- Asia Pacific (APAC)
- China
- Japan
- India
- Australia
- South Korea
- Rest of Asia Pacific (RoAPAC)
- Latin America (LATAM)
- Brazil
- Argentina
- Rest of South America
- Middle East and Africa (MEA)
- UAE
- Turkey
- Saudi Arabia
- South Africa
- Rest of Middle East & Africa
The market has been divided into compact, full-scale, and sophisticated driving simulators based on simulator type. In terms of revenue, the compact simulator segment dominated the market in 2019 and is anticipated to keep leading over the forecast period. Due to its small size, compact driving simulators are utilised for a variety of vehicles, including cars, bikes, trucks, and buses. Additionally, compared to other machine kinds, such as full-scale and advanced simulators, compact simulators are more cost-effective. As a result, they are frequently employed for instructional reasons by driving schools and local driving instructors.
Due to its technologically cutting-edge features, including a 360 viewing angle and a motion platform, which give trainees a genuine experience, the advanced driving simulator category is predicted to have the largest growth throughout the projection period. Additionally, automakers have begun employing these driving simulations to test advanced vehicles’ characteristics in augmented environments, including their acceleration, braking, steering, and aerodynamics. Additionally, using these testing devices helps academics and engineers create intelligent roadway designs and carry out studies on human behaviour, such as how drivers behave in bad weather and while under the influence of alcohol and other substances.
The global driving simulator market has been segmented into three categories based on application: research & testing, training, and motorsports & gaming. In 2019 the research and testing segment dominated the market, and during the forecast period it is anticipated to grow at the highest rate. This is a result of the development of autonomous vehicles. In order to provide completely autonomous vehicles to the market, automakers from all over the world are making enormous investments in R&D. The demand for driving simulators is increased as a result of these manufacturers using them to evaluate the performance of the driverless vehicles in real-time.
In 2019, the training sector accounted for a sizeable portion of the market. Basic driving lessons are taught using driving simulators by training facilities, which is fostering the segment’s expansion. Drivers can be exposed to a variety of tough conditions in a safe setting with the help of simulation-based training. Additionally, driving simulations are used to teach seasoned drivers high order driving skills, such as avoiding collisions when driving in fog. In conclusion, the usage of driving simulators in driver training is enhancing both novice and experienced drivers’ driving abilities.
The market has been divided into automotive, marine, and aerospace segments based on end use. Due to the widespread use of both passenger and commercial cars in 2019, the automotive sector held a sizeable proportion. According to the International Organisation of Motor Vehicle Manufacturers (OICA), there were roughly 70 million passenger vehicles produced worldwide in 2018.
Additionally, major investments are being made in R&D by automakers like BMW, Tesla, Honda, and Toyota to improve the designs and models of current vehicles and bring autonomous vehicles to market. Because driving simulators can simulate a variety of operational situations, including driving in bad weather, heavy traffic, and uneven roads, these manufacturers utilise them to test the real-world performance and capabilities of the vehicles.
Airlines, aviation training facilities, and airlines are using driving simulators more and more frequently worldwide. Unmanned aerial vehicles (AEV), commercial helicopters and aircraft, military aircraft, and other platforms all use flight simulators. Due to the rise in commercial air travel around the world, there is a significant demand for qualified pilots or staff. This has influenced the growth in the use of these equipment for training.
Europe dominated the market in 2019 in terms of revenue, and it is anticipated that it will continue to do so throughout the projected period. Major contributors to this region’s growth are the U.K. and Germany. Many major automakers, including Mercedes, BMW, Audi, and Porsche, are based in Germany. These businesses are well renowned for developing cutting-edge automotive technology like automated parking, adaptive cruise control, and connected car platforms. As a result, these businesses are developing the best in class car technology by employing driving simulators as a tool to evaluate vehicle performance.
Due to rising R&D efforts in the automotive industry, Asia Pacific is predicted to experience the highest growth throughout the projection period. Asia Pacific is seen as a developing region, and nations like China, India, and Japan are making efforts to entice auto OEMs to establish or expand manufacturing operations in the area. For instance, the German automaker Volkswagen inaugurated a new R&D plant in Pune, India, in January 2019. In addition, a number of Asian automakers, including Honda Motor Company Ltd., are expanding their regional production capacities. As a result, expanding R&D efforts are anticipated to support regional market expansion.
- This report illustrates the most vital attributes of the Driving Simulator Market, which are driving and providing opportunities.
- This research gives an in-depth analysis of the Driving Simulator Market growth on the basis of several segments in the market.
- This report presents the predictions of the past and present trends of the Driving Simulator Market.
- This study also presents the competitive analysis, such as key strategies and capabilities of major players of the Driving Simulator Market.
