The area of molecular biology known as genomics is concerned with the structure, operation, growth, and mapping of genomes. The genomics industry has had a significant impact on healthcare over time. The genomic revolution is having a significant impact on how medicine and biomedicine are practised. Government funding for genomics efforts has expanded as a result of the rising incidence of cancer worldwide. The discovery of the human genome led to the development of personalised medicine and altered the clinical landscape of the treatment of cancer and uncommon genetic illnesses.
Healthcare has been significantly impacted by the genomics market over time. The genetic revolution is causing tremendous developments in biology and medicine. Government funding for genomics projects has increased as a result of the growing cancer burden across the world. The analysis of the human genome transformed the way that cancer is treated and how rare genetic illnesses are treated clinically, leading to the development of personalised medicine.The size of the global genomics market was estimated to be USD 29.35 billion in 2022, and it is anticipated to grow at a CAGR of 18.4% from 2022 to 2027.
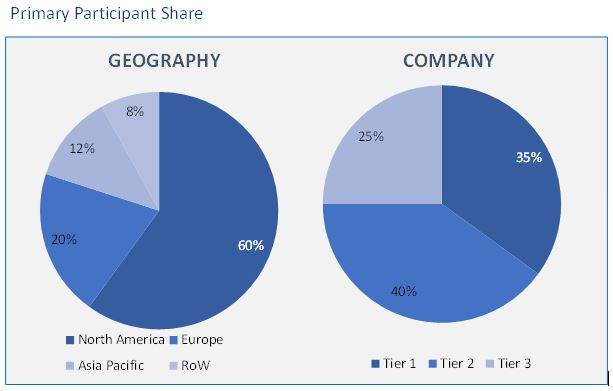
Research Methodology:
The key drivers of the genomics market’s expansion include rising government assistance, a rise in genomic research, falling sequencing prices, and a rise in genomic applications. Due to fundamental genetic advancements and their applications in numerous research areas, such as intragenomic phenomena like epistasis, heterosis, pleiotropy, and other genomic interactions between alleles and loci, the genomic business is expanding exponentially. Additionally, biotechnology and synthetic biology applications are expected to drive the growth of the genomics market.The primary participants share is given below:
Genomics Market based on Type:
- Products (Instruments & Software and Consumables)
- Services
Genomics Market based on Technology:
- Sequencing
- PCR
- Flow Cytometry
- Microarrays
- Other Technologies (electrophoresis, southern blotting, isothermal nucleic acid amplification, and in situ hybridization)
Genomics Market based on Application:
- Drug Discovery and Development
- Diagnostics
- Agriculture and Animal research
- Other Applications (marine research, biofuel research, food industry, and forensics)
Genomics Market based on Study Type:
- Functional Genomics
- Biomarker Discovery
- Pathway Analysis
- Epigenomics
- Other Study Types (structural genomics, comparative genomics, and mutation genomics)
Genomics Market based on End User:
- Hospitals and Clinics
- Academic and Research Institutes
- Pharmaceutical & Biotechnology companies
- Other End Users (agrigenomics organizations, marine research organizations, forensic organizations, and food organizations)
Genomics Market based on Region:
- North America
- Europe
- Germany
- UK
- France
- Italy
- Spain
- Rest of Europe (RoE)
- Asia Pacific (APAC)
- China
- Japan
- India
- Australia
- South Korea
- Rest of Asia Pacific (RoAPAC)
- Latin America (LATAM)
- Brazil
- Argentina
- Rest of South America
- Middle East and Africa (MEA)
- UAE
- Turkey
- Saudi Arabia
- South Africa
- Rest of Middle East & Africa
The Service segment is likely to contribute the highest market share at a fastest CAGR during the forecast period due to the growing number of genomic services start-ups. Over the years, genomic research has helped to forecast illness risk, generate new medicines, and advance our clinical world. Individual genomic data holds the key to predicting and treating disease in clinical medicine in the future. Our genetic variation biomarkers are the key to this novel advancement.
In functional genomics, real-time PCR was the most profitable method, accounting for more than 30%. Real-time quantitative PCR has greatly contributed to the absolute measurement of the genetic components of genomic DNA. This approach was used to test the use of tissue genomic DNA as a universal external standard to speed up the measurement of any target sequence in the genome of different animals. Especially in developed markets, the ranking process is quite mature. The advantages of sequencing technologies, including high throughput, scalability and speed, enable researchers to perform a wide range of tasks, including livestock, agriculture and human genomics.
In terms of end use, the genomics market is segmented into Academic Institutes, Hospitals & Clinics, Pharmaceutical & Biotechnology Companies and Others. Significant investments by biotechnology and pharmaceutical businesses have contributed considerably to the revenue generated by the biomarker discovery application sector in terms of future research and development for predictive biomarkers geared toward diagnosis and patient monitoring. Clinical trials involving genomes sequencing have been extremely successful, prompting an avalanche of disease-based research to investigate its use for novel treatment options and a frenetic quest for biomarkers. During the projected period, revenue in the hospital and clinics category is predicted to expand at a stable rate. This is due to the fact that genomics plays a significant role in hospitals.
In 2021, the genomics market in North America accounted for the largest share of the global market. Availability of funding from both the government and molecular biology research companies are important factors driving the North American market. Genomic engineering is often used by pharmaceutical companies to create high quality drugs such as IVT (in vitro transcribed) mRNA. In addition, several major companies in the region offer effective genomic solutions. As investments in genetic research and development increase, and the government encourages research in the field of genomics, and the cost of mass genetic testing is significantly reduced in the region, the Asia Pacific region will grow significantly during the forecast period. 2022 to 2028. Active government support, particularly in the UK and England through research funding and genomic analysis and research and academic institutions, is expected to encourage business expansion in Europe.
Global genomics market is being driven by increased application Next-Generation Sequencing (NGS) which is becoming more widely used in cancer research. Whole-genome sequencing, genome diversity inquiry, metagenomics, epigenetics, the discovery of non-coding RNAs and protein-binding sites, and gene-expression profiling by RNA sequencing are all applications of NGS technologies contributing to capturing the genomics market share.
This report provides with a few notable vendors of the genomics market, which include Illumina, Inc. (U.S.), Thermo Fisher Scientific Inc. (U.S.), F. Hoffmann-La Roche Ltd. (Switzerland), Agilent Technologies, Inc. (U.S.), Oxford Nanopore Technologies (U.K.), Danaher (U.S.), QIAGEN (Germany), BGI (China), IntegraGen (France), General Electric Company (U.S.).
Increasing government funding in the field of microbiology and genetics is one of the major driving factors promoting the growth of the genomics market, which is a key benefit of genomics.
- This report illustrates the most vitalattributes of the genomics market,which are driving and providing opportunities.
- This research gives an in-depth analysis of the genomics market growth on the basisofseveral segments in the market.
- This reportpresents the predictions of the past and present trends of the genomics market.
This study also presents the competitive analysis, such as key strategies and capabilities of major players of the genomics market.
List of Tables
TABLE 1. GENOMICS MARKET VALUE, BY TYPE, 2021-2027 (USD BILLION)
TABLE 2. GENOMICS MARKET VALUE FOR PRODUCT AND SERVICES, BY GEOGRAPHY, 2021-2027 (USD BILLION)
TABLE 3. GENOMICS MARKET VALUE FOR CONSUMABLES AND REAGENTS, BY GEOGRAPHY, 2021-2027 (USD BILLION)
TABLE 4. GENOMICS MARKET VALUE FOR SERVICES, BY GEOGRAPHY, 2021-2027 (USD BILLION)
TABLE 5. GENOMICS MARKET VALUE FOR INSTRUMENTS,SYSTEMS AND SOFTWARE, BY GEOGRAPHY, 2021-2027 (USD BILLION)
TABLE 6. GENOMICS MARKET VALUE, BY TECHNOLOGY, BY GEOGRAPHY, 2021-2027 (USD BILLION)
TABLE 7. GENOMICS MARKET VALUE FOR SEQUENCING, BY GEOGRAPHY, 2021-2027 (USD BILLION)
TABLE 8. GENOMICS MARKET VALUE FOR PCR, BY GEOGRAPHY, 2021-2027 (USD BILLION)
TABLE 9. GENOMICS MARKET VALUE FOR FLOW CYTOMETRY, BY GEOGRAPHY, 2021-2027 (USD BILLION)
TABLE 10. GENOMICS MARKET VALUE FOR MICROARRAYS, BY GEOGRAPHY, 2021-2027 (USD BILLION)
TABLE 11. GENOMICS MARKET VALUE, BY APPLICATION, BY GEOGRAPHY, 2021-2027 (USD BILLION)
TABLE 12. GENOMICS MARKET VALUE FOR DRUG DISCOVERY AND DEVELOPMENT, BY GEOGRAPHY, 2021-2027 (USD BILLION)
TABLE 13. GENOMICS MARKET VALUE FOR DIAGNOSTICS, BY GEOGRAPHY, 2021-2027 (USD BILLION)
TABLE 14. GENOMICS MARKET VALUE FOR AGRICULTURE AND ANIMAL RESEARCH, BY GEOGRAPHY, 2021-2027 (USD BILLION)
TABLE 15. GENOMICS MARKET VALUE FOR OTHERS, BY GEOGRAPHY, 2021-2027 (USD BILLION)
TABLE 16. GENOMICS MARKET VALUE, BY STUDY TYPE, BY GEOGRAPHY, 2021-2027 (USD BILLION)
TABLE 17. GENOMICS MARKET VALUE FOR FUNCTIONAL GENOMICS, BY GEOGRAPHY, 2021-2027 (USD BILLION)
TABLE 18. GENOMICS MARKET VALUE FOR BIOMARKER DISCOVERY, BY GEOGRAPHY, 2021-2027 (USD BILLION)
TABLE 19. GENOMICS MARKET VALUE FOR PATHWAY ANALYSIS, BY GEOGRAPHY, 2021-2027 (USD BILLION)
TABLE 20. GENOMICS MARKET VALUE FOR OTHERS, BY GEOGRAPHY, 2021-2027 (USD BILLION)
TABLE 21. GENOMICS MARKET VALUE, BY END-USER, 2021-2027 (USD BILLION)
TABLE 22. GENOMICS MARKET VALUE FOR HOSPITALS, BY GEOGRAPHY, 2021-2027 (USD BILLION)
TABLE 23. GENOMICS MARKET VALUE FOR ACADEMICS AND RESEARCH INSTITUTE, BY GEOGRAPHY, 2021-2027 (USD BILLION)
TABLE 24. GENOMICS MARKET VALUE FOR OTHERS, BY GEOGRAPHY, 2021-2027 (USD BILLION)
TABLE 25. NORTH AMERICA GENOMICS MARKET VALUE, BY COUNTRY, 2021-2027 (USD BILLION)
TABLE 26. NORTH AMERICA GENOMICS MARKET VALUE, BY TYPE, 2021-2027 (USD BILLION)
TABLE 27. NORTH AMERICA GENOMICS MARKET VALUE, BY TECHNOLOGY, 2021-2027 (USD BILLION)
TABLE 28. NORTH AMERICA GENOMICS MARKET VALUE, BY END-USER, 2021-2027 (USD BILLION)
TABLE 29. U.S GENOMICS MARKET VALUE, BY TYPE, 2021-2027 (USD BILLION)
TABLE 30. U.S GENOMICS MARKET VALUE, BY TECHNOLOGY, 2021-2027 (USD BILLION)
TABLE 31. U.S GENOMICS MARKET VALUE, BY END-USER, 2021-2027 (USD BILLION)
TABLE 32. CANADA GENOMICS MARKET VALUE, BY TYPE, 2021-2027 (USD BILLION)
TABLE 33. CANADA GENOMICS MARKET VALUE, BY TECHNOLOGY, 2021-2027 (USD BILLION)
TABLE 34. CANADA GENOMICS MARKET VALUE, BY END-USER, 2021-2027 (USD BILLION)
TABLE 35. EUROPE GENOMICS MARKET VALUE, BY COUNTRY, 2021-2027 (USD BILLION)
TABLE 36. EUROPE GENOMICS MARKET VALUE, BY TYPE, 2021-2027 (USD BILLION)
TABLE 37. EUROPE GENOMICS MARKET VALUE, BY TECHNOLOGY, 2021-2027 (USD BILLION)
TABLE 38. EUROPE GENOMICS MARKET VALUE, END-USER, 2021-2027 (USD BILLION)
TABLE 39. GERMANY GENOMICS MARKET VALUE, BY TYPE, 2021-2027 (USD BILLION)
TABLE 40. GERMANY GENOMICS MARKET VALUE, BY TECHNOLOGY, 2021-2027 (USD BILLION)
TABLE 41. GERMANY GENOMICS MARKET VALUE, BY END-USER, 2021-2027 (USD BILLION)
TABLE 42. U.K GENOMICS MARKET VALUE, BY TYPE, 2021-2027 (USD BILLION)
TABLE 43. U.K GENOMICSMARKET VALUE, BY TECHNOLOGY, 2021-2027 (USD BILLION)
TABLE 44. U.K GENOMICS MARKET VALUE, BY END-USER, 2021-2027 (USD BILLION)
TABLE 45. FRANCE GENOMICS MARKET VALUE, BY TYPE, 2021-2027 (USD BILLION)
TABLE 46. FRANCE GENOMICS MARKET VALUE, BY TECHNOLOGY, 2021-2027 (USD BILLION)
TABLE 47. FRANCE GENOMICS MARKET VALUE, BY END-USER, 2021-2027 (USD BILLION)
TABLE 48. ITALY GENOMICS MARKET VALUE, BY TYPE, 2021-2027 (USD BILLION)
TABLE 49. ITALY GENOMICS MARKET VALUE, BY TECHNOLOGY, 2021-2027 (USD BILLION)
TABLE 50. ITALY GENOMICS MARKET VALUE, BY END-USER, 2021-2027 (USD BILLION)
TABLE 51. SPAIN GENOMICS MARKET VALUE, BY TYPE, 2021-2027 (USD BILLION)
TABLE 52. SPAIN GENOMICS MARKET VALUE, BY TECHNOLOGY, 2021-2027 (USD BILLION)
TABLE 53. SPAIN GENOMICS MARKET VALUE, BY END-USER, 2021-2027 (USD BILLION)
TABLE 54. ROE GENOMICS MARKET VALUE, BY TYPE, 2021-2027 (USD BILLION)
TABLE 55. ROE GENOMICS MARKET VALUE, BY TECHNOLOGY, 2021-2027 (USD BILLION)
TABLE 56. ROE GENOMICS MARKET VALUE, BY END-USER, 2021-2027 (USD BILLION)
TABLE 57. ASIA PACIFIC GENOMICS MARKET VALUE, BY COUNTRY, 2021-2027 (USD BILLION)
TABLE 58. ASIA PACIFIC GENOMICS MARKET VALUE, BY TYPE, 2021-2027 (USD BILLION)
TABLE 59. ASIA PACIFIC GENOMICS MARKET VALUE, BY TECHNOLOGY, 2021-2027 (USD BILLION)
TABLE 60. ASIA PACIFIC GENOMICS MARKET VALUE, BY END-USER, 2021-2027 (USD BILLION)
TABLE 61. CHINA GENOMICS MARKET VALUE, BY TYPE, 2021-2027 (USD BILLION)
TABLE 62. CHINA GENOMICS MARKET VALUE, BY TECHNOLOGY, 2021-2027 (USD BILLION)
TABLE 63. CHINA GENOMICS MARKET VALUE, BY END-USER, 2021-2027 (USD BILLION)
TABLE 64. INDIA GENOMICS MARKET VALUE, BY TYPE, 2021-2027 (USD BILLION)
TABLE 65. INDIA GENOMICS MARKET VALUE, BY TECHNOLOGY, 2021-2027 (USD BILLION)
TABLE 66. INDIA GENOMICS MARKET VALUE, BY END-USER, 2021-2027 (USD BILLION)
TABLE 67. JAPAN GENOMICS MARKET VALUE, BY TYPE, 2021-2027 (USD BILLION)
TABLE 68. JAPAN GENOMICS MARKET VALUE, BY TECHNOLOGY, 2021-2027 (USD BILLION)
TABLE 69. JAPAN GENOMICS MARKET VALUE, BY END-USER, 2021-2027 (USD BILLION)
TABLE 70. REST OF APAC GENOMICS MARKET VALUE, BY TYPE, 2021-2027 (USD BILLION)
TABLE 71. REST OF APAC GENOMICS MARKET VALUE, BY TECHNOLOGY, 2021-2027 (USD BILLION)
TABLE 72. REST OF APAC GENOMICS MARKET VALUE, BY END-USER, 2021-2027 (USD BILLION)
TABLE 73. LATIN AMERICA GENOMICS MARKET VALUE, BY TYPE, 2021-2030 (USD BILLION)
TABLE 74. LATIN AMERICA GENOMICS MARKET VALUE, BY TECHNOLOGY, 2021-2030 (USD BILLION)
TABLE 75. LATIN AMERICA GENOMICS MARKET VALUE, BY END-USER, 2021-2030 (USD BILLION)
TABLE 76. BRAZIL GENOMICS MARKET VALUE, BY TYPE, 2021-2030 (USD BILLION)
TABLE 77. BRAZIL GENOMICS MARKET VALUE, BY TECHNOLOGY, 2021-2030 (USD BILLION)
TABLE 78. BRAZIL GENOMICS MARKET VALUE, BY END-USER, 2021-2030 (USD BILLION)
TABLE 79. ARGENTINA GENOMICS MARKET VALUE, BY TYPE, 2021-2030 (USD BILLION)
TABLE 80. ARGENTINA GENOMICS MARKET VALUE, BY TECHNOLOGY, 2021-2030 (USD BILLION)
TABLE 81. ARGENTINA GENOMICS MARKET VALUE, BY END-USER, 2021-2030 (USD BILLION)
TABLE 82. MIDDLE EAST AND AFRICA GENOMICS MARKET VALUE, BY TYPE, 2021-2030 (USD BILLION)
TABLE 83. MIDDLE EAST AND AFRICA GENOMICS MARKET VALUE, BY TECHNOLOGY, 2021-2030 (USD BILLION)
TABLE 84. MIDDLE EAST AND AFRICA GENOMICS MARKET VALUE, BY END-USER, 2021-2030 (USD BILLION)
TABLE 85. SAUDI ARABIA GENOMICS MARKET VALUE, BY TYPE, 2021-2030 (USD BILLION)
TABLE 86. SAUDI ARABIA GENOMICS MARKET VALUE, BY TECHNOLOGY, 2021-2030 (USD BILLION)
TABLE 87. SAUDI ARABIA GENOMICS MARKET VALUE, BY END-USER, 2021-2030 (USD BILLION)
TABLE 88. UAE GENOMICS MARKET VALUE, BY TYPE, 2021-2030 (USD BILLION)
TABLE 89. UAE GENOMICS MARKET VALUE, BY TECHNOLOGY, 2021-2030 (USD BILLION)
TABLE 90. UAE GENOMICS MARKET VALUE, BY END-USER, 2021-2030 (USD BILLION)
TABLE 91. REST OF MIDDLE EAST AND AFRICA GENOMICS MARKET VALUE, BY TYPE, 2021-2030 (USD BILLION)
TABLE 92. REST OF MIDDLE EAST AND AFRICA GENOMICS MARKET VALUE, BY TECHNOLOGY, 2021-2030 (USD BILLION)
TABLE 93. REST OF MIDDLE EAST AND AFRICA GENOMICS MARKET VALUE, BY END-USER, 2021-2030 (USD BILLION)
TABLE 94. CHART INDUSTRIES, INC.: FINANCIALS
TABLE 95. CHART INDUSTRIES, INC.: PRODUCTS & SERVICES
TABLE 96. CHART INDUSTRIES, INC.: RECENT DEVELOPMENTS
TABLE 97. NIDEK MEDICAL PRODUCTS, INC: FINANCIALS
TABLE 98. NIDEK MEDICAL PRODUCTS, INC: PRODUCTS & SERVICES
TABLE 99. NIDEK MEDICAL PRODUCTS, INC: RECENT DEVELOPMENTS
TABLE 100. BESCO MEDICAL CO. LTD: FINANCIALS
TABLE 101. BESCO MEDICAL CO. LTD: PRODUCTS & SERVICES
TABLE 102. BESCO MEDICAL CO. LTD: RECENT DEVELOPMENTS
TABLE 103. KONINKLIJKE PHILIPS N.V: FINANCIALS
TABLE 104. KONINKLIJKE PHILIPS N.V: PRODUCTS & SERVICES
TABLE 105. KONINKLIJKE PHILIPS N.V: RECENT DEVELOPMENTS
TABLE 106. DRIVE DEVILBISS HEALTHCARE LLC: FINANCIALS
TABLE 107. DRIVE DEVILBISS HEALTHCARE LLC: PRODUCTS & SERVICES
TABLE 108. DRIVE DEVILBISS HEALTHCARE LLC: RECENT DEVELOPMENTS
TABLE 109. PRECISION MEDICAL, INC: FINANCIALS
TABLE 110. PRECISION MEDICAL, INC: PRODUCTS & SERVICES
TABLE 111. PRECISION MEDICAL, INC: RECENT DEVELOPMENTS
TABLE 112. INVACARE CORPORATION: FINANCIALS
TABLE 113. INVACARE CORPORATION: PRODUCTS & SERVICES
TABLE 114. INVACARE CORPORATION: RECENT DEVELOPMENTS
TABLE 115. AIRSEP CORPORATION: FINANCIALS
TABLE 116. AIRSEP CORPORATION: PRODUCTS & SERVICES
TABLE 117. AIRSEP CORPORATION: RECENT DEVELOPMENTS
TABLE 118. PHILIPS HEALTHCARE: FINANCIALS
TABLE 119. PHILIPS HEALTHCARE: PRODUCTS & SERVICES
TABLE 120. PHILIPS HEALTHCARE: RECENT DEVELOPMENTS
TABLE 121. O2 CONCEPTS, LLC: FINANCIALS
TABLE 122. O2 CONCEPTS, LLC: PRODUCTS & SERVICES
TABLE 123. O2 CONCEPTS, LLC: RECENT DEVELOPMENTS


