The growing demand for off-grid electricity and renewable energy is driving a positive expansion in the hybrid power solutions industry. The primary factor propelling the market’s growth is the substantial increase in investments in rural electrification. Aside from this, the market for hybrid power solutions is expanding as a result of numerous government incentives and manufacturers’ easy accessibility. However, the biggest obstacles to the market’s growth rate for hybrid power solutions are a longer payback period and a substantial initial investment. On the other hand, complex system integration could provide development obstacles for the market for hybrid power solutions. The global market for hybrid power solutions is growing at a substantial compound annual growth rate (CAGR) due to factors such as dependable power generation with little fuel use and lower operations and maintenance expenses.
Moreover, over the forecast period, the growing use of renewable energy sources and the full electrification of rural areas through the use of hybrid power solutions will offer additional opportunities for market advancement. Hybrid systems are becoming more and more common because of their exceptional characteristics and advantages for reducing carbon emissions. These technologies also use less fuel to get maximum output. Furthermore, as the world’s attention has grown more focused on hybrid power solution systems, the market has moved its attention.
Research Methodology:
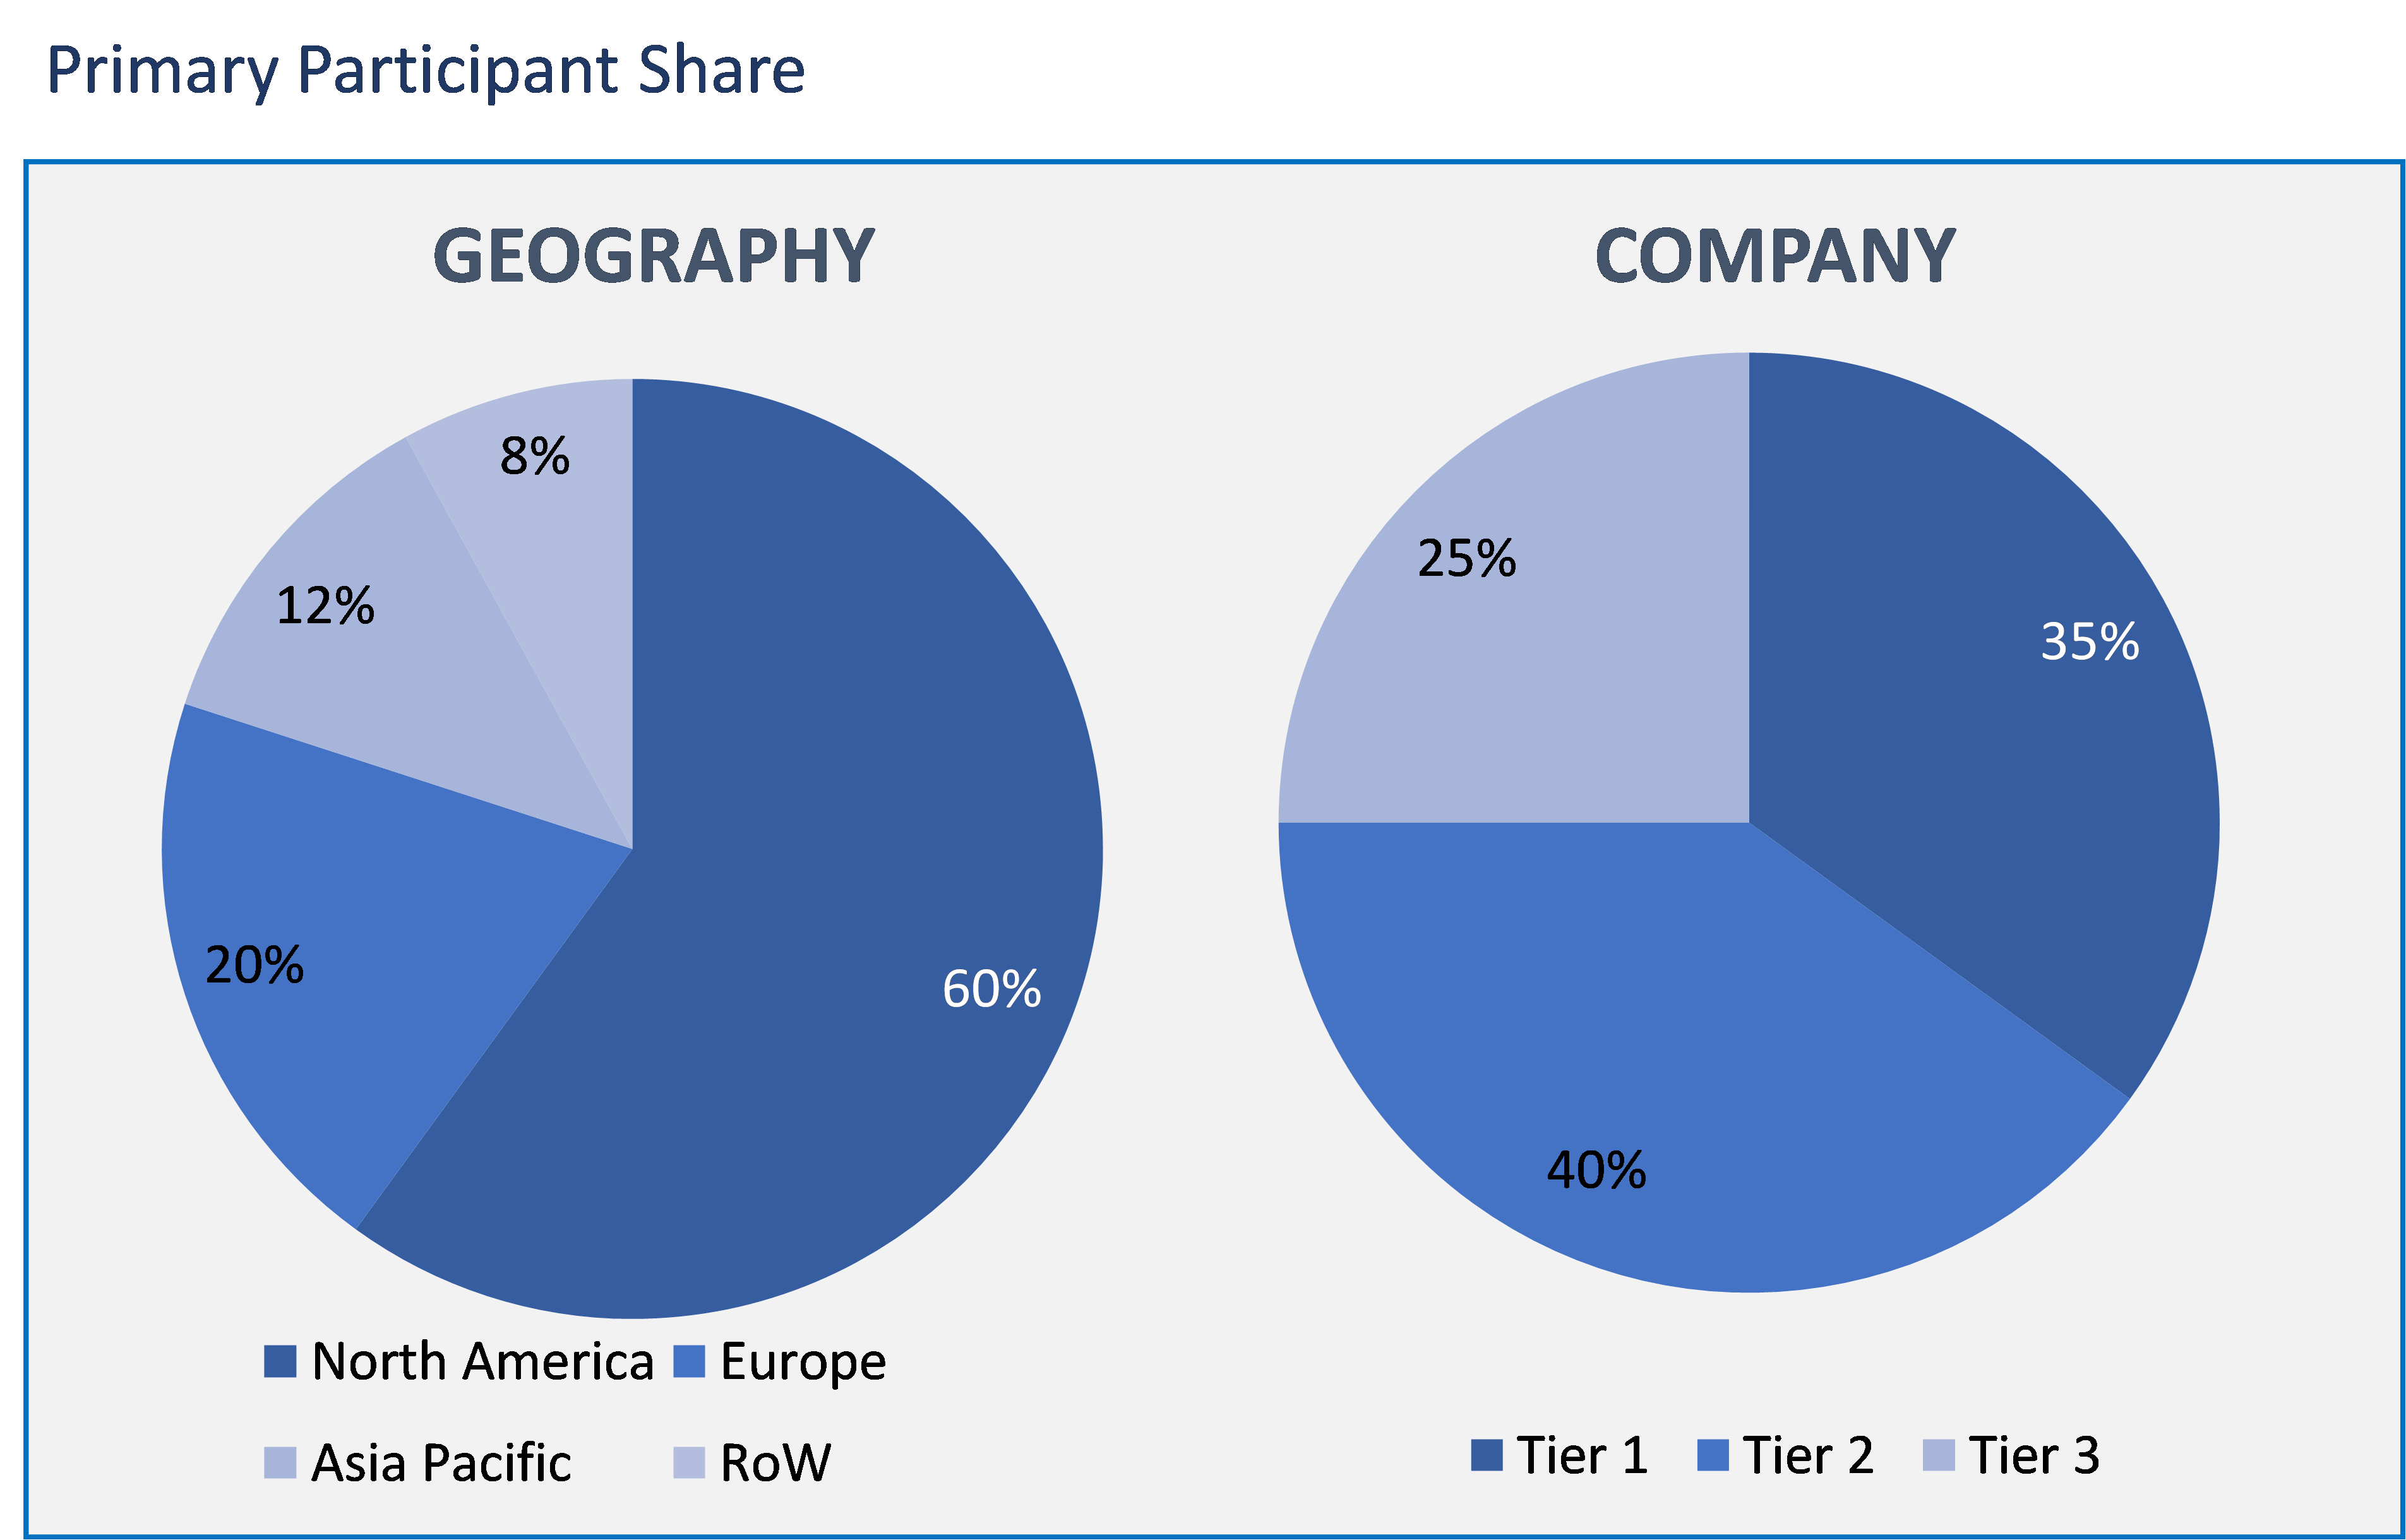
After secondary research provided a fundamental understanding of the worldwide Hybrid Power Solution Market scenario, extensive primary research was carried out. A number of primary interviews were carried out with industry experts from the supply and demand sides, including C- and D-level executives, product managers, and marketing and sales managers of major manufacturers, distributors, and channel partners from tier 1 and tier 2 companies offering Market, as well as personnel from academia, research, and CROs. These interviews were conducted across five major regions: North America, Europe, Asia Pacific, and the Rest of the World (Latin America & the Middle East & Africa). Participants from the supply-side and demand-side participated in about 70% and 30% of the primary interviews, respectively. Through the use of questionnaires, emails, online surveys, in-person interviews, and phone interviews, this main data was gathered. The primary participants share is given below:
The segmentation coverage of the study is provided below.
Hybrid Power Solutions Market based on Product:
- Wind Diesel
- Wind Solar Diesel
- Solar Diesel
- Others
Hybrid Power Solutions Market based on End use:
- Residential
- Commercial
- Telecom
- Others
Hybrid Power Solutions Market based on Geography:
- North America
- Europe
- Germany
- UK
- France
- Italy
- Spain
- Rest of Europe (RoE)
- Asia Pacific (APAC)
- China
- Japan
- India
- Australia
- South Korea
- Rest of Asia Pacific (RoAPAC)
- Latin America (LATAM)
- Brazil
- Argentina
- Rest of South America
- Middle East and Africa (MEA)
- UAE
- Turkey
- Saudi Arabia
- South Africa
- Rest of Middle East & Africa
The Hybrid Power Solutions Market is divided into four product categories: Wind Diesel, Wind Solar Diesel, Solar Diesel, and Others. Because the wind-diesel system uses a diesel generator and a wind turbine to create electricity, wind diesel dominated the market. Fuel usage and running costs are decreased by the system. Strong winds are a prerequisite for these generators to function well. Diesel generators can counteract the energy produced by moderate to low wind conditions, guaranteeing an intermittent source of electricity.
The Hybrid Power Solutions Market is segmented into residential, commercial, telecom, and other end-use categories. The residential sector dominated the market; diesel generators by themselves are unable to meet demand in rural areas because of issues like high fuel consumption and low efficiency; hybrid power solutions, on the other hand, offer the chance to supply load over night, which is anticipated to positively impact residential demand.
The report offers market insights by region for the following areas: North America, Europe, Asia-Pacific, and the Rest of the World. The market for hybrid power solutions in Asia-Pacific will be the largest. This is because the region’s market will develop more quickly because to advanced renewable energy technology, rising petroleum product prices, and power generation using less fuel. Furthermore, the Asia-Pacific region’s hybrid power solution market was developing at the highest rate in India, while China held the largest market share.
The U.S., Canada, Germany, France, the UK, Italy, Spain, China, Japan, India, Australia, South Korea, and Brazil are among the other key nations examined in the market study.
- This report illustrates the most vital attributes of the Hybrid Power Solution Market, which are driving and providing opportunities.
- This research gives an in-depth analysis of the Hybrid Power Solution Market growth on the basis of several segments in the market.
- This report presents the predictions of the past and present trends of the Hybrid Power Solution Market.
- This study also presents the competitive analysis, such as key strategies and capabilities of major players of the Hybrid Power Solution Market.
Methodology
Infoholic Research works on a holistic 360° approach in order to deliver high quality, validated and reliable information in our market reports. The Market estimation and forecasting involves following steps:
- Data Collation (Primary & Secondary)
- In-house Estimation (Based on proprietary data bases and Models)
- Market Triangulation
- Forecasting

List of Tables
TABLE 1. HYBRID POWER SOLUTIONS MARKET VALUE, BY PRODUCT, 2021-2030 (USD BILLION)
TABLE 2. HYBRID POWER SOLUTIONS MARKET VALUE FOR WIND DIESEL, BY GEOGRAPHY , 2021-2030 (USD BILLION)
TABLE 3. HYBRID POWER SOLUTIONS MARKET VALUE FOR WIND SOLAR DIESEL, BY GEOGRAPHY, 2021-2030 (USD BILLION)
TABLE 4. HYBRID POWER SOLUTIONS MARKET VALUE FOR SOLAR DIESEL, BY GEOGRAPHY , 2021-2030 (USD BILLION)
TABLE 5. HYBRID POWER SOLUTIONS MARKET VALUE FOR OTHERS, BY GEOGRAPHY, 2021-2030 (USD BILLION)
TABLE 6. HYBRID POWER SOLUTIONS MARKET VALUE, BY END USE, 2021-2030 (USD BILLION)
TABLE 7. HYBRID POWER SOLUTIONS MARKET VALUE FOR RESIDENTIAL, BY GEOGRAPHY , 2021-2030 (USD BILLION)
TABLE 8. HYBRID POWER SOLUTIONS MARKET VALUE FOR COMMERCIAL, BY GEOGRAPHY , 2021-2030 (USD BILLION)
TABLE 9. HYBRID POWER SOLUTIONS MARKET VALUE FOR TELECOM, BY GEOGRAPHY , 2021-2030 (USD BILLION)
TABLE 10. HYBRID POWER SOLUTIONS MARKET VALUE FOR OTHERS, BY GEOGRAPHY , 2021-2030 (USD BILLION)
TABLE 11. NORTH AMERICA HYBRID POWER SOLUTIONS MARKET VALUE, BY COUNTRY, 2021-2030 (USD BILLION)
TABLE 12. NORTH AMERICA HYBRID POWER SOLUTIONS MARKET VALUE, BY PRODUCT, 2021-2030 (USD BILLION)
TABLE 13. NORTH AMERICA HYBRID POWER SOLUTIONS MARKET VALUE, BY END USE, 2021-2030 (USD BILLION)
TABLE 14. U.S HYBRID POWER SOLUTIONS MARKET VALUE, BY PRODUCT, 2021-2030 (USD BILLION)
TABLE 15. U.S HYBRID POWER SOLUTIONS MARKET VALUE, BY END USE, 2021-2030 (USD BILLION)
TABLE 16. CANADA HYBRID POWER SOLUTIONS MARKET VALUE, BY PRODUCT, 2021-2030 (USD BILLION)
TABLE 17. CANADA HYBRID POWER SOLUTIONS MARKET VALUE, BY END USE, 2021-2030 (USD BILLION)
TABLE 18. MEXICO HYBRID POWER SOLUTIONS MARKET VALUE, BY PRODUCT, 2021-2030 (USD BILLION)
TABLE 19. MEXICO HYBRID POWER SOLUTIONS MARKET VALUE, BY END USE, 2021-2030 (USD BILLION)
TABLE 20. EUROPE HYBRID POWER SOLUTIONS MARKET VALUE, BY COUNTRY, 2021-2030 (USD BILLION)
TABLE 21. EUROPE HYBRID POWER SOLUTIONS MARKET VALUE, BY PRODUCT, 2021-2030 (USD BILLION)
TABLE 22. EUROPE HYBRID POWER SOLUTIONS MARKET VALUE, BY END USE, 2021-2030 (USD BILLION)
TABLE 23. GERMANY HYBRID POWER SOLUTIONS MARKET VALUE, BY PRODUCT, 2021-2030 (USD BILLION)
TABLE 24. GERMANY HYBRID POWER SOLUTIONS MARKET VALUE, BY END USE, 2021-2030 (USD BILLION)
TABLE 25. U.K HYBRID POWER SOLUTIONS MARKET VALUE, BY PRODUCT, 2021-2030 (USD BILLION)
TABLE 26. U.K HYBRID POWER SOLUTIONS MARKET VALUE, BY END USE, 2021-2030 (USD BILLION)
TABLE 27. FRANCE HYBRID POWER SOLUTIONS MARKET VALUE, BY PRODUCT, 2021-2030 (USD BILLION)
TABLE 28. FRANCE HYBRID POWER SOLUTIONS MARKET VALUE, BY END USE, 2021-2030 (USD BILLION)
TABLE 29. ITALY HYBRID POWER SOLUTIONS MARKET VALUE, BY PRODUCT, 2021-2030 (USD BILLION)
TABLE 30. ITALY HYBRID POWER SOLUTIONS MARKET VALUE, BY END USE, 2021-2030 (USD BILLION)
TABLE 31. SPAIN HYBRID POWER SOLUTIONS MARKET VALUE, BY PRODUCT, 2021-2030 (USD BILLION)
TABLE 32. SPAIN HYBRID POWER SOLUTIONS MARKET VALUE, BY END USE, 2021-2030 (USD BILLION)
TABLE 33. ROE HYBRID POWER SOLUTIONS MARKET VALUE, BY PRODUCT, 2021-2030 (USD BILLION)
TABLE 34. ROE HYBRID POWER SOLUTIONS MARKET VALUE, BY END USE, 2021-2030 (USD BILLION)
TABLE 35. ASIA PACIFIC HYBRID POWER SOLUTIONS MARKET VALUE, BY COUNTRY, 2021-2030 (USD BILLION)
TABLE 36. ASIA PACIFIC HYBRID POWER SOLUTIONS MARKET VALUE, BY PRODUCT, 2021-2030 (USD BILLION)
TABLE 37. ASIA PACIFIC HYBRID POWER SOLUTIONS MARKET VALUE, BY END USE, 2021-2030 (USD BILLION)
TABLE 38. CHINA HYBRID POWER SOLUTIONS MARKET VALUE, BY PRODUCT, 2021-2030 (USD BILLION)
TABLE 39. CHINA HYBRID POWER SOLUTIONS MARKET VALUE, BY END USE, 2021-2030 (USD BILLION)
TABLE 40. INDIA HYBRID POWER SOLUTIONS MARKET VALUE, BY PRODUCT, 2021-2030 (USD BILLION)
TABLE 41. INDIA HYBRID POWER SOLUTIONS MARKET VALUE, BY END USE, 2021-2030 (USD BILLION)
TABLE 42. JAPAN HYBRID POWER SOLUTIONS MARKET VALUE, BY PRODUCT, 2021-2030 (USD BILLION)
TABLE 43. JAPAN HYBRID POWER SOLUTIONS MARKET VALUE, BY END USE, 2021-2030 (USD BILLION)
TABLE 44. REST OF APAC HYBRID POWER SOLUTIONS MARKET VALUE, BY PRODUCT, 2021-2030 (USD BILLION)
TABLE 45. REST OF APAC HYBRID POWER SOLUTIONS MARKET VALUE, BY END USE, 2021-2030 (USD BILLION)
TABLE 46. LATIN AMERICA HYBRID POWER SOLUTIONS MARKET VALUE, BY PRODUCT, 2021-2030 (USD BILLION)
TABLE 47. LATIN AMERICA HYBRID POWER SOLUTIONS MARKET VALUE, BY END USE, 2021-2030 (USD BILLION)
TABLE 48. BRAZIL HYBRID POWER SOLUTIONS MARKET VALUE, BY PRODUCT, 2021-2030 (USD BILLION)
TABLE 49. BRAZIL HYBRID POWER SOLUTIONS MARKET VALUE, BY END USE, 2021-2030 (USD BILLION)
TABLE 50. ARGENTINA HYBRID POWER SOLUTIONS MARKET VALUE, BY PRODUCT, 2021-2030 (USD BILLION)
TABLE 51. ARGENTINA HYBRID POWER SOLUTIONS MARKET VALUE, BY END USE, 2021-2030 (USD BILLION)
TABLE 52. MIDDLE EAST AND AFRICA HYBRID POWER SOLUTIONS MARKET VALUE, BY PRODUCT, 2021-2030 (USD BILLION)
TABLE 53. MIDDLE EAST AND AFRICA HYBRID POWER SOLUTIONS MARKET VALUE, BY END USE, 2021-2030 (USD BILLION)
TABLE 54. SAUDI ARABIA HYBRID POWER SOLUTIONS MARKET VALUE, BY PRODUCT, 2021-2030 (USD BILLION)
TABLE 55. SAUDI ARABIA HYBRID POWER SOLUTIONS MARKET VALUE, BY END USE, 2021-2030 (USD BILLION)
TABLE 56. UAE HYBRID POWER SOLUTIONS MARKET VALUE, BY PRODUCT, 2021-2030 (USD BILLION)
TABLE 57. UAE HYBRID POWER SOLUTIONS MARKET VALUE, BY END USE, 2021-2030 (USD BILLION)
TABLE 58. REST OF MIDDLE EAST AND AFRICA HYBRID POWER SOLUTIONS MARKET VALUE, BY PRODUCT, 2021-2030 (USD BILLION)
TABLE 59. REST OF MIDDLE EAST AND AFRICA HYBRID POWER SOLUTIONS MARKET VALUE, BY END USE, 2021-2030 (USD BILLION)
TABLE 60. GENERAL ELECTRIC : FINANCIALS
TABLE 61. GENERAL ELECTRIC : PRODUCTS & SERVICES
TABLE 62. GENERAL ELECTRIC : RECENT DEVELOPMENTS
TABLE 63. MAN ENERGY SOLUTIONS SE: FINANCIALS
TABLE 64. MAN ENERGY SOLUTIONS SE: PRODUCTS & SERVICES
TABLE 65. MAN ENERGY SOLUTIONS SE: RECENT DEVELOPMENTS
TABLE 66. KYOCERA CORPORATION: FINANCIALS
TABLE 67. KYOCERA CORPORATION: PRODUCTS & SERVICES
TABLE 68. KYOCERA CORPORATION: RECENT DEVELOPMENTS
TABLE 69. EATON: FINANCIALS
TABLE 70. EATON: PRODUCTS & SERVICES
TABLE 71. EATON: RECENT DEVELOPMENTS
TABLE 72. IBERDROLA: FINANCIALS
TABLE 73. IBERDROLA: PRODUCTS & SERVICES
TABLE 74. IBERDROLA: RECENT DEVELOPMENTS
TABLE 75. PANASONIC CORPORATION: FINANCIALS
TABLE 76. PANASONIC CORPORATION: PRODUCTS & SERVICES
TABLE 77. PANASONIC CORPORATION: RECENT DEVELOPMENTS
TABLE 78. SCHNEIDER ELECTRIC: FINANCIALS
TABLE 79. SCHNEIDER ELECTRIC: PRODUCTS & SERVICES
TABLE 80. SCHNEIDER ELECTRIC: DEVELOPMENTS
TABLE 81. SHARP ELECTRONICS: FINANCIALS
TABLE 82. SHARP ELECTRONICS: PRODUCTS & SERVICES
TABLE 83. SHARP ELECTRONICS: RECENT DEVELOPMENTS
TABLE 84. SUZLON GROUP: FINANCIALS
TABLE 85. SUZLON GROUP: PRODUCTS & SERVICES
TABLE 86. SUZLON GROUP: RECENT DEVELOPMENTS
TABLE 87. SIEMENS GAMESA: FINANCIALS
TABLE 88. SIEMENS GAMESA: PRODUCTS & SERVICES
TABLE 89. SIEMENS GAMESA: RECENT DEVELOPMENTS

