Wireless connectivity is necessary for all telematics solutions to provide an improved user experience. To improve the security and effectiveness of telematics solutions, many telecom sector firms are creating 5G. It would be able to give minimal latency and create 1 million connections per square kilometre while offering 99.999% reliability. V2V and V2I communication is accelerated by 5G, which offers more bandwidth than earlier network generations. In contrast to 4G, 5G supports more connections without interference thanks to its usage of a wide variety of radio spectrum frequencies.
The telematics industry’s handling of enormous amounts of data has caused an explosion of AI in the automobile sector. In telematics systems, artificial intelligence (AI) is utilised for a variety of functions, including speech and gesture recognition, eye tracking, enhanced HMI, driver monitoring, virtual assistance, radar-based detection units, and engine control units (fused with sensors). According to estimates, machine learning, which is used to apply AI, is developing more quickly than other technologies in the automobile industry.
The producers of components and parts, suppliers of raw materials, telematics solution providers, and OEMs make up the market ecosystem. The use of AI and other connected technologies to track and trace the status, position, wear and tear, and movements of vehicles, equipment, and other assets is known as telematics. OEMs immediately deploy these systems and install them in their vehicle models after telematics manufacturers and system integrators create telematic solutions in accordance with OEM needs and purchase hardware and software from vendors.
Research Methodology:
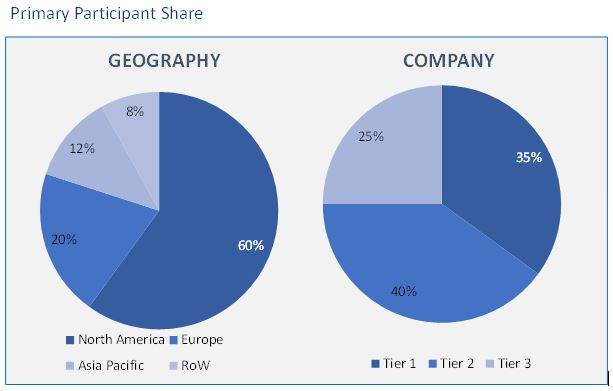
We employ a thorough research technique that includes data triangulation using top-down and bottom-up approaches as well as primary research to validate the projected market sizes. The most reliable published sources and interviews with the appropriate stakeholders were used to gather the data required to estimate the market size and forecast for key segments at the global, regional, and country level. A market’s growth rate, or CAGR, for a particular forecast period is computed based on a number of variables and how much of an impact they have on the market. These elements consist of market stimuli, market inhibitors, industry difficulties, market and technology advancements, market trends, etc. The primary participants share is given below:
Telematics Solutions Market based on Service
- Information and Navigation
- Safety and Security
- Fleet/Asset Management
- Insurance Telematics
- Infotainment System
Telematics Solutions Market based on Technology
- Integrated
- Tethered
- Embedded
Telematics Solutions Market based on Sales Channel
Telematics Solutions Market based on Vehicle Type
- Passenger Car
- Commercial Vehicles
Telematics Solutions Market based on Geography
- North America
- Europe
- Germany
- UK
- France
- Italy
- Spain
- Rest of Europe (RoE)
- Asia Pacific (APAC)
- China
- Japan
- India
- Australia
- South Korea
- Rest of Asia Pacific (RoAPAC)
- Latin America (LATAM)
- Brazil
- Argentina
- Rest of South America
- Middle East and Africa (MEA)
- UAE
- Turkey
- Saudi Arabia
- South Africa
- Rest of Middle East & Africa
The market is divided into information and navigation, safety and security, fleet/asset management, insurance telematics, and infotainment system categories based on the services they provide.Usage-Based Insurance (UBI) solutions’ increasing adoption across the automobile industry is predicted to fuel market expansion. Insurance telematics tracks a driver’s behaviours while they are driving and stores the information. It primarily serves as a miniature GPS that is mounted in the car. The category growth is predicted to be fueled by the rising demand for business models like ride-sharing, carpooling, and car-sharing. Telematics is increasingly being used in the insurance industry since insurance companies are offering savings on normal premiums based on real-time driver monitoring.
Throughout the projected period, the fleet/asset management market is anticipated to expand steadily. The fleet and asset management industry offers numerous services, including GPS tracking, vehicle data recording, fuel management, on-road assistance, and emergency services. It is projected that the category growth will be aided by the rising demand from owners of commercial vehicles for fleet management software and services.
The market is segmented into embedded, tethered, and integrated segments based on technology. By 2030, the embedded segment is anticipated to hold a sizable market share and be in the lead. The embedded component provides a built-in system that aids in keeping track of vehicle performance and guarantees ongoing connectivity. A cellular modem is put inside the car similarly to smartphones. The car may communicate with other devices via a cellular network, such as cell phones, thanks to its modem. Almost all automakers offer embedded telematics on the majority of their vehicle models. Around 80% of newly manufactured cars in the US have incorporated telematics.
During the projection period, the integrated segment is anticipated to increase significantly. Due to services like quick reaction to accidents, breakdowns, emergency service, prompt response to roadside assistance, and many more, this market is in high demand. As this telematics establishes a connection between headquarters and the fleet both on and off the road, the need for integrated segments is increasing. The demand for these services is rising, which is accelerating market expansion.
The market is divided into OEM and aftermarket based on sales channel. Over the projection period, the OEM segment is anticipated to grow at a 16.84% rate. The advantages of factory-installed telematics devices, such as their ease of use and low cost, will drive market expansion. Additionally, software and services play a big role in the growth of OEM telematics. For instance, Ford Commercial Solutions unveiled Ford Telematics in June 2020, a web-based software platform and subscription service designed to give fleet managers quick access to the connected vehicle’s critical data. In 2022, the aftermarket sector accounted for a sizeable portion of the market. Due to huge fleet companies, mining and oil firms, and other businesses that are forced to track their cars, the demand for aftermarket telematics solutions is on the rise. Since these fleet management solutions may be tailored to the demands of the owners, the aftermarket for vehicle telematics is predicted to present a significant growth opportunity. Some of the services provided at a lower cost than the OEM include stolen car tracking, fuel management, engine monitoring systems, and in-vehicle monitor systems. Fleet owners’ rising telematics service demand is predicted to fuel the aftermarket segment’s expansion.
The market is split into two categories based on the kind of vehicle: passenger cars and commercial vehicles. The demand of consumers for telematics systems offering cutting-edge services like roadside assistance, emergency services, real-time tracking, and vehicle maintenance warnings is expected to drive the expansion of the passenger car market. Most embedded fleet management solutions are found in premium and luxury passenger vehicles. But as the level of competition rises, more and more automakers are including telematics systems in the cheapest models of their cars. Additionally, it is projected that the growing preference of consumers for electric vehicles with innovative features will drive market expansion.
In 2022, Europe had the majority of the worldwide market share for vehicle telematics. The region’s market is expanding as a result of the increased attention being paid to accident prevention and the safety and security of drivers and passengers. Additionally, it is predicted that market expansion in this region will be fueled by the strategic cooperation of the competitors to improve market positioning. For instance, Qualcomm Technologies, Inc. and Renault Group announced their plans to increase their cooperation in January 2022. Through this partnership, Renault will be able to offer its next-generation vehicles the most cutting-edge connected and intelligent technologies.
One of the key factors fueling the market expansion in the area is the rise in electric car sales in the U.S. Additionally, the government’s encouragement of the use of vehicle fleet management systems is promoting business expansion in the area.
- This report illustrates the most vital attributes of the Telematics Solutions Market, which are driving and providing opportunities.
- This research gives an in-depth analysis of the Telematics Solutions Market growth on the basis of several segments in the market.
- This report presents the predictions of the past and present trends of the Telematics Solutions Market.
- This study also presents the competitive analysis, such as key strategies and capabilities of major players of the Telematics Solutions Market.
List of Tables
TABLE 1. TELEMATICS SOLUTIONS MARKET, BY SERVICE, 2021-2030 (USD BILLION)
TABLE 2. TELEMATICS SOLUTIONS MARKET FOR INFORMATION AND NAVIGATION, BY GEOGRAPHY, 2021-2030 (USD BILLION)
TABLE 3. TELEMATICS SOLUTIONS MARKET FOR SAFETY AND SECURITY, BY GEOGRAPHY, 2021-2030 (USD BILLION)
TABLE 4. TELEMATICS SOLUTIONS MARKET FOR FLEET/ASSET MANAGEMENT, BY GEOGRAPHY, 2021-2030 (USD BILLION)
TABLE 5. TELEMATICS SOLUTIONS MARKET FOR INSURANCE TELEMATICS, BY GEOGRAPHY, 2021-2030 (USD BILLION)
TABLE 6. TELEMATICS SOLUTIONS MARKET FOR INFOTAINMENT SYSTEM, BY GEOGRAPHY, 2021-2030 (USD BILLION)
TABLE 7. TELEMATICS SOLUTIONS MARKET, BY SERVICES, 2021-2030 (USD BILLION)
TABLE 8. TELEMATICS SOLUTIONS MARKET FOR INTEGRATED, 2021-2030 (USD BILLION)
TABLE 9. TELEMATICS SOLUTIONS MARKET FOR TETHERED, 2021-2030 (USD BILLION)
TABLE 10. TELEMATICS SOLUTIONS MARKET FOR EMBEDDED, 2021-2030 (USD BILLION)
TABLE 11. TELEMATICS SOLUTIONS MARKET, BY SALES CHANNEL, 2021-2030 (USD BILLION)
TABLE 12. TELEMATICS SOLUTIONS MARKET FOR OEM, 2021-2030 (USD BILLION)
TABLE 13. TELEMATICS SOLUTIONS MARKET FOR AFTER MARKET, 2021-2030 (USD BILLION)
TABLE 14. TELEMATICS SOLUTIONS MARKET, BY VEHICLE TYPE, 2021-2030 (USD BILLION)
TABLE 15. TELEMATICS SOLUTIONS MARKET FOR PASSENGER CAR, 2021-2030 (USD BILLION)
TABLE 16. TELEMATICS SOLUTIONS MARKET FOR COMMERCIAL VEHICLES, 2021-2030 (USD BILLION)
TABLE 17. NORTH AMERICA TELEMATICS SOLUTIONS MARKET, BY COUNTRY, 2021-2030 (USD BILLION)
TABLE 18. NORTH AMERICA TELEMATICS SOLUTIONS MARKET, BY SERVICES, 2021-2030 (USD BILLION)
TABLE 19. NORTH AMERICA TELEMATICS SOLUTIONS MARKET, BY TECHNOLOGY, 2021-2030 (USD BILLION)
TABLE 20. NORTH AMERICA TELEMATICS SOLUTIONS MARKET, BY SALES CHANNEL, 2021-2030 (USD BILLION)
TABLE 21. U.S TELEMATICS SOLUTIONS MARKET, BY SERVICES, 2021-2030 (USD BILLION)
TABLE 22. U.S TELEMATICS SOLUTIONS MARKET, BY TECHNOLOGY, 2021-2030 (USD BILLION)
TABLE 23. U.S TELEMATICS SOLUTIONS MARKET, BY SALES CHANNEL, 2021-2030 (USD BILLION)
TABLE 24. CANADA TELEMATICS SOLUTIONS MARKET, BY SERVICES, 2021-2030 (USD BILLION)
TABLE 25. CANADA TELEMATICS SOLUTIONS MARKET, BY TECHNOLOGY, 2021-2030 (USD BILLION)
TABLE 26. CANADA TELEMATICS SOLUTIONS MARKET, BY SALES CHANNEL, 2021-2030 (USD BILLION)
TABLE 27. MEXICO TELEMATICS SOLUTIONS MARKET, BY SERVICES, 2021-2030 (USD BILLION)
TABLE 28. MEXICO TELEMATICS SOLUTIONS MARKET, BY TECHNOLOGY, 2021-2030 (USD BILLION)
TABLE 29. MEXICO TELEMATICS SOLUTIONS MARKET, BY SALES CHANNEL, 2021-2030 (USD BILLION)
TABLE 30. EUROPE TELEMATICS SOLUTIONS MARKET, BY COUNTRY, 2021-2030 (USD BILLION)
TABLE 31. EUROPE TELEMATICS SOLUTIONS MARKET, BY SERVICES, 2021-2030 (USD BILLION)
TABLE 32. EUROPE TELEMATICS SOLUTIONS MARKET, BY TECHNOLOGY, 2021-2030 (USD BILLION)
TABLE 33. EUROPE TELEMATICS SOLUTIONS MARKET, RANGE, 2021-2030 (USD BILLION)
TABLE 34. GERMANY TELEMATICS SOLUTIONS MARKET, BY SERVICES, 2021-2030 (USD BILLION)
TABLE 35. GERMANY TELEMATICS SOLUTIONS MARKET, BY TECHNOLOGY, 2021-2030 (USD BILLION)
TABLE 36. GERMANY TELEMATICS SOLUTIONS MARKET, BY SALES CHANNEL, 2021-2030 (USD BILLION)
TABLE 37. U.K TELEMATICS SOLUTIONS MARKET, BY SERVICES, 2021-2030 (USD BILLION)
TABLE 38. U.K TELEMATICS SOLUTIONS MARKET, BY TECHNOLOGY, 2021-2030 (USD BILLION)
TABLE 39. U.K TELEMATICS SOLUTIONS MARKET, BY SALES CHANNEL, 2021-2030 (USD BILLION)
TABLE 40. FRANCE TELEMATICS SOLUTIONS MARKET, BY SERVICES, 2021-2030 (USD BILLION)
TABLE 41. FRANCE TELEMATICS SOLUTIONS MARKET, BY TECHNOLOGY, 2021-2030 (USD BILLION)
TABLE 42. FRANCE TELEMATICS SOLUTIONS MARKET, BY SALES CHANNEL, 2021-2030 (USD BILLION)
TABLE 43. ITALY TELEMATICS SOLUTIONS MARKET, BY SERVICES, 2021-2030 (USD BILLION)
TABLE 44. ITALY TELEMATICS SOLUTIONS MARKET, BY TECHNOLOGY, 2021-2030 (USD BILLION)
TABLE 45. ITALY TELEMATICS SOLUTIONS MARKET, BY SALES CHANNEL, 2021-2030 (USD BILLION)
TABLE 46. SPAIN TELEMATICS SOLUTIONS MARKET, BY SERVICES, 2021-2030 (USD BILLION)
TABLE 47. SPAIN TELEMATICS SOLUTIONS MARKET, BY TECHNOLOGY, 2021-2030 (USD BILLION)
TABLE 48. SPAIN TELEMATICS SOLUTIONS MARKET, BY SALES CHANNEL, 2021-2030 (USD BILLION)
TABLE 49. ROE TELEMATICS SOLUTIONS MARKET, BY SERVICES, 2021-2030 (USD BILLION)
TABLE 50. ROE TELEMATICS SOLUTIONS MARKET, BY TECHNOLOGY, 2021-2030 (USD BILLION)
TABLE 51. ROE TELEMATICS SOLUTIONS MARKET, BY SALES CHANNEL, 2021-2030 (USD BILLION)
TABLE 52. ASIA PACIFIC TELEMATICS SOLUTIONS MARKET, BY COUNTRY, 2021-2030 (USD BILLION)
TABLE 53. ASIA PACIFIC TELEMATICS SOLUTIONS MARKET, BY SERVICES, 2021-2030 (USD BILLION)
TABLE 54. ASIA PACIFIC TELEMATICS SOLUTIONS MARKET, BY TECHNOLOGY, 2021-2030 (USD BILLION)
TABLE 55. ASIA PACIFIC TELEMATICS SOLUTIONS MARKET, BY SALES CHANNEL, 2021-2030 (USD BILLION)
TABLE 56. CHINA TELEMATICS SOLUTIONS MARKET, BY SERVICES, 2021-2030 (USD BILLION)
TABLE 57. CHINA TELEMATICS SOLUTIONS MARKET, BY TECHNOLOGY, 2021-2030 (USD BILLION)
TABLE 58. CHINA TELEMATICS SOLUTIONS MARKET, BY SALES CHANNEL, 2021-2030 (USD BILLION)
TABLE 59. INDIA TELEMATICS SOLUTIONS MARKET, BY SERVICES, 2021-2030 (USD BILLION)
TABLE 60. INDIA TELEMATICS SOLUTIONS MARKET, BY TECHNOLOGY, 2021-2030 (USD BILLION)
TABLE 61. INDIA TELEMATICS SOLUTIONS MARKET, BY SALES CHANNEL, 2021-2030 (USD BILLION)
TABLE 62. JAPAN TELEMATICS SOLUTIONS MARKET, BY SERVICES, 2021-2030 (USD BILLION)
TABLE 63. JAPAN TELEMATICS SOLUTIONS MARKET, BY TECHNOLOGY, 2021-2030 (USD BILLION)
TABLE 64. JAPAN TELEMATICS SOLUTIONS MARKET, BY SALES CHANNEL, 2021-2030 (USD BILLION)
TABLE 65. REST OF APAC TELEMATICS SOLUTIONS MARKET, BY SERVICES, 2021-2030 (USD BILLION)
TABLE 66. REST OF APAC TELEMATICS SOLUTIONS MARKET, BY TECHNOLOGY, 2021-2030 (USD BILLION)
TABLE 67. REST OF APAC TELEMATICS SOLUTIONS MARKET, BY SALES CHANNEL, 2021-2030 (USD BILLION)
TABLE 68. LATIN AMERICA TELEMATICS SOLUTIONS MARKET, BY SERVICES, 2021-2030 (USD BILLION)
TABLE 69. LATIN AMERICA TELEMATICS SOLUTIONS MARKET, BY TECHNOLOGY, 2021-2030 (USD BILLION)
TABLE 70. LATIN AMERICA TELEMATICS SOLUTIONS MARKET, BY SALES CHANNEL, 2021-2030 (USD BILLION)
TABLE 71. BRAZIL TELEMATICS SOLUTIONS MARKET, BY SERVICES, 2021-2030 (USD BILLION)
TABLE 72. BRAZIL TELEMATICS SOLUTIONS MARKET, BY TECHNOLOGY, 2021-2030 (USD BILLION)
TABLE 73. BRAZIL TELEMATICS SOLUTIONS MARKET, BY SALES CHANNEL, 2021-2030 (USD BILLION)
TABLE 74. ARGENTINA TELEMATICS SOLUTIONS MARKET, BY SERVICES, 2021-2030 (USD BILLION)
TABLE 75. ARGENTINA TELEMATICS SOLUTIONS MARKET, BY TECHNOLOGY, 2021-2030 (USD BILLION)
TABLE 76. ARGENTINA TELEMATICS SOLUTIONS MARKET, BY SALES CHANNEL, 2021-2030 (USD BILLION)
TABLE 77. MIDDLE EAST AND AFRICA TELEMATICS SOLUTIONS MARKET, BY SERVICES, 2021-2030 (USD BILLION)
TABLE 78. MIDDLE EAST AND AFRICA TELEMATICS SOLUTIONS MARKET, BY TECHNOLOGY, 2021-2030 (USD BILLION)
TABLE 79. MIDDLE EAST AND AFRICA TELEMATICS SOLUTIONS MARKET, BY SALES CHANNEL, 2021-2030 (USD BILLION)
TABLE 80. SAUDI ARABIA TELEMATICS SOLUTIONS MARKET, BY SERVICES, 2021-2030 (USD BILLION)
TABLE 81. SAUDI ARABIA TELEMATICS SOLUTIONS MARKET, BY TECHNOLOGY, 2021-2030 (USD BILLION)
TABLE 82. SAUDI ARABIA TELEMATICS SOLUTIONS MARKET, BY SALES CHANNEL, 2021-2030 (USD BILLION)
TABLE 83. UAE TELEMATICS SOLUTIONS MARKET, BY SERVICES, 2021-2030 (USD BILLION)
TABLE 84. UAE TELEMATICS SOLUTIONS MARKET, BY TECHNOLOGY, 2021-2030 (USD BILLION)
TABLE 85. UAE TELEMATICS SOLUTIONS MARKET, BY SALES CHANNEL, 2021-2030 (USD BILLION)
TABLE 86. REST OF MIDDLE EAST AND AFRICA TELEMATICS SOLUTIONS MARKET, BY SERVICES, 2021-2030 (USD BILLION)
TABLE 87. REST OF MIDDLE EAST AND AFRICA TELEMATICS SOLUTIONS MARKET, BY TECHNOLOGY, 2021-2030 (USD BILLION)
TABLE 88. REST OF MIDDLE EAST AND AFRICA TELEMATICS SOLUTIONS MARKET, BY SALES CHANNEL, 2021-2030 (USD BILLION)
TABLE 89. ROBERT BOSCH GMBH (GERMANY): FINANCIALS
TABLE 90. ROBERT BOSCH GMBH (GERMANY): PRODUCTS & SERVICES
TABLE 91. ROBERT BOSCH GMBH (GERMANY): RECENT DEVELOPMENTS
TABLE 92. WEBFLEET SOLUTIONS B.V. (NETHERLANDS): FINANCIALS
TABLE 93. WEBFLEET SOLUTIONS B.V. (NETHERLANDS): PRODUCTS & SERVICES
TABLE 94. WEBFLEET SOLUTIONS B.V. (NETHERLANDS): RECENT DEVELOPMENTS
TABLE 95. MIX TELEMATICS (SOUTH AFRICA): FINANCIALS
TABLE 96. MIX TELEMATICS (SOUTH AFRICA): PRODUCTS & SERVICES
TABLE 97. MIX TELEMATICS (SOUTH AFRICA): RECENT DEVELOPMENTS
TABLE 98. TRIMBLE (U.S.): FINANCIALS
TABLE 99. TRIMBLE (U.S.): PRODUCTS & SERVICES
TABLE 100. TRIMBLE (U.S.): RECENT DEVELOPMENTS
TABLE 101. VERIZON (U.S.): FINANCIALS
TABLE 102. VERIZON (U.S.): PRODUCTS & SERVICES
TABLE 103. VERIZON (U.S.): RECENT DEVELOPMENTS
TABLE 104. ZONAR SYSTEMS (U.S.): FINANCIALS
TABLE 105. ZONAR SYSTEMS (U.S.): PRODUCTS & SERVICES
TABLE 106. ZONAR SYSTEMS (U.S.): RECENT DEVELOPMENTS
TABLE 107. OCTO GROUP S.P.A (ITALY): FINANCIALS
TABLE 108. OCTO GROUP S.P.A (ITALY): PRODUCTS & SERVICES
TABLE 109. OCTO GROUP S.P.A (ITALY): RECENT DEVELOPMENTS
TABLE 110. MICROLISE TELEMATICS PVT. LTD. (U.K.): FINANCIALS
TABLE 111. MICROLISE TELEMATICS PVT. LTD. (U.K.): PRODUCTS & SERVICES
TABLE 112. MICROLISE TELEMATICS PVT. LTD. (U.K.): RECENT DEVELOPMENTS
TABLE 113. HARMAN INTERNATIONAL (U.S.): FINANCIALS
TABLE 114. HARMAN INTERNATIONAL (U.S.): PRODUCTS & SERVICES
TABLE 115. HARMAN INTERNATIONAL (U.S.): RECENT DEVELOPMENTS
TABLE 116. BMW GROUP (GERMANY): FINANCIALS
TABLE 117. BMW GROUP (GERMANY): PRODUCTS & SERVICES
TABLE 118. BMW GROUP (GERMANY): RECENT DEVELOPMENTS


