The increasing usage of these materials in the production of structural composite parts for passenger aircraft, commercial aircraft, helicopters, and other aircraft is what is driving the need for thermoset composites. The primary factor driving the market is the quick uptake of thermoset composites, which are used in interior components and offer high strength, improved physical qualities, and stiffness/density ratios. In the near future, it is expected that the market would be driven by increased usage of thermoset composites in transportation due to the increasing demand for light vehicles and the strong demand for thermoset composites in the wind power industry.
In the upcoming years, the industry is expected to be hampered by concerns regarding the recyclable nature and potential for reuse of thermoset composites. Additionally, the market is constrained by the high price of thermoset composites R&D.
Due to the growing demand for the material in the polymer sector, glass fibre is likely to gain a larger proportion of the thermoset composites market over the anticipated timeframe. The market for thermoset composites is anticipated to grow as a result of the anticipated time frame. With prospects in the construction, energy, wind, electronics, transportation, maritime, consumer products, and water industries, the market has a promising future.
Research Methodology:
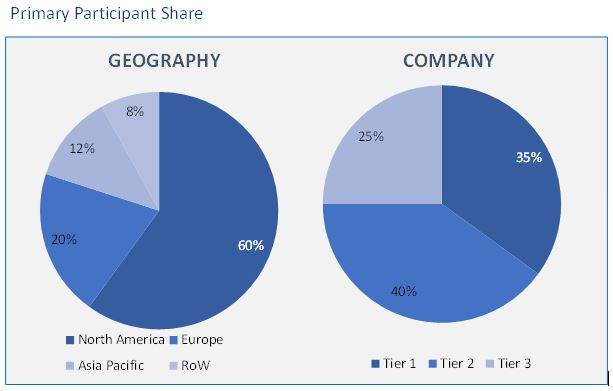
Due to rising demand for epoxy resins from a variety of industries, including aerospace & defence, wind energy, transportation, marine, pipe & tank, among others, epoxy resins are predicted to dominate the worldwide thermoset composites market. Revenue in the epoxy sector is predicted to grow at the highest CAGR. Due to several characteristics supplied by these fibres, such as flexibility, a high strength-to-weight ratio, and great durability, the glass fibre sector is anticipated to account for the majority share in terms of revenue in the global market. The revenue for the glass fibre sector is also predicted to grow at the greatest CAGR throughout the projection period. According to end-use industries, the transportation sector is anticipated to hold a sizable revenue share in the global market. Revenue for the transport sector is expected to grow at the highest CAGR throughout the projection period. The primary participants share is given below:
Thermoset Composites Market based on End-Use Industry:
- Transportation
- Aerospace & Defense
- Sporting Goods
- Wind Energy
- Construction & Infrastructure
- Pipe & Tank
- Marine
- Electrical & Electronics
- Others
Thermoset Composites Market based on Fiber Type:
- Carbon Fiber
- Glass Fiber
- Other Fiber
Thermoset Composites Market based on Manufacturing Process:
- Lay-Up
- Filament Winding
- Resin Infusion
- Compression Molding
- Injection Molding
- Pultrusion
- Others
Thermoset Composites Market based on Resin type:
- Building & Construction
- Transportation
- Consumer Goods
- Others
Thermoset Composites Market based on Geography:
- North America
- Europe
- Germany
- UK
- France
- Italy
- Spain
- Rest of Europe (RoE)
- Asia Pacific (APAC)
- China
- Japan
- India
- Australia
- South Korea
- Rest of Asia Pacific (RoAPAC)
- Latin America (LATAM)
- Brazil
- Argentina
- Rest of South America
- Middle East and Africa (MEA)
- UAE
- Turkey
- Saudi Arabia
- South Africa
- Rest of Middle East & Africa
The market for thermoset composites is anticipated to reach USD 68.98 billion by 2030, growing at a 6.64% CAGR between 2016 and 2030. great strength, light weight, low specific gravity, great elasticity modulus, and high corrosion resistance are only a few of the characteristics of thermoset composites. Thermoset composites’ better qualities have helped them become more widely used in a variety of end-use industries, including wind energy, automotive, building & infrastructure, and others. One of the key reasons propelling the growth of the thermoset composite market is the rising demand for lightweight and robust alternative materials from the aerospace, automotive, and transportation sectors.
The geography, end-use industry, resin type, production technique, and fibre type are the key segments used to divide the thermoset composites market. In terms of value and volume, the thermoset composite market’s largest end-use industry share in 2016 belonged to the wind energy sector. The development of wind turbine blades and spar caps, which use thermoset composites more and more, is primarily responsible for this high percentage. Due to the use of thermoset composites in high-end cars, rail, and medium- and heavy-duty vehicles, the transportation end-use industry segment is anticipated to increase rapidly between 2016 and 2030.
The thermoset composites market has been divided into segments based on the resin type, including polyester, epoxy, vinyl ester, phenolic, and polyurethane. Due to the high yield and superior processing characteristics of epoxy resins, the polyester resin type segment had the biggest share in terms of volume and the epoxy resin type segment had the largest share in terms of value. Glass and carbon fibre are used as reinforcing when creating thermoset composites. In terms of fibre type, the thermoset composite market was led in 2016 by the glass fibre segment.
During the projection period, the thermoset composites market is expected to be the largest and expanding the quickest in Asia-Pacific. This is because there are well-known thermoset producers here, and there are more wind turbines being installed. The market’s expansion is constrained by problems with recycling, disposal, and testing thermoset composites. Because thermoset composites cannot be remoulded like thermoplastic composites, their use in the electronics and transportation industries is rather constrained.
- This report illustrates the most vital attributes of the Market, which are driving and providing opportunities.
- This research gives an in-depth analysis of the Market growth on the basis of several segments in the market.
- This report presents the predictions of the past and present trends of the Market.
- This study also presents the competitive analysis, such as key strategies and capabilities of major players of the Market.
List of Tables
TABLE 1. THERMOSET COMPOSITES MARKET VALUE, BY END USE INDUSTRY, 2021-2030 (USD BILLION)
TABLE 2. THERMOSET COMPOSITES MARKET VALUE FOR TRANSPORTATION, BY GEOGRAPHY, 2021-2030 (USD BILLION)
TABLE 3. THERMOSET COMPOSITES MARKET VALUE FOR AEROSPACE & DEFENSE, BY GEOGRAPHY, 2021-2030 (USD BILLION)
TABLE 4. THERMOSET COMPOSITES MARKET VALUE FOR SPORTING GOODS, BY GEOGRAPHY, 2021-2030 (USD BILLION)
TABLE 5. THERMOSET COMPOSITES MARKET VALUE FOR WIND ENERGY, BY GEOGRAPHY, 2021-2030 (USD BILLION)
TABLE 6. THERMOSET COMPOSITES MARKET VALUE FOR OTHERS, BY GEOGRAPHY, 2021-2030 (USD BILLION)
TABLE 7. THERMOSET COMPOSITES MARKET VALUE, BY FIBER TYPE, 2021-2030 (USD BILLION)
TABLE 8. THERMOSET COMPOSITES MARKET VALUE FOR CARBON FIBER, 2021-2030 (USD BILLION)
TABLE 9. THERMOSET COMPOSITES MARKET VALUE FOR GLASS FIBER, BY GEOGRAPHY, 2021-2030 (USD BILLION)
TABLE 10. THERMOSET COMPOSITES MARKET VALUE, FOR MANUFACTURING PROCESS, 2021-2030 (USD BILLION)
TABLE 11. THERMOSET COMPOSITES MARKET VALUE FOR LAYUP, BY GEOGRAPHY, 2021-2030 (USD BILLION)
TABLE 12. THERMOSET COMPOSITES MARKET VALUE, FOR RESIN TYPE, 2021-2030 (USD BILLION)
TABLE 13. THERMOSET COMPOSITES MARKET VALUE FOR OTHERS, BY GEOGRAPHY, 2021-2030 (USD BILLION)
TABLE 14. NORTH AMERICA THERMOSET COMPOSITES MARKET VALUE, BY COUNTRY, 2021-2030 (USD BILLION)
TABLE 15. NORTH AMERICA THERMOSET COMPOSITES MARKET VALUE, BY END USE INDUSTRY, 2021-2030 (USD BILLION)
TABLE 16. NORTH AMERICA THERMOSET COMPOSITES MARKET VALUE, BY FIBER TYPE, 2021-2030 (USD BILLION)
TABLE 17. NORTH AMERICA THERMOSET COMPOSITES MARKET VALUE, BY MANUFACTURING PROCESS, 2021-2030 (USD BILLION)
TABLE 18. U.S THERMOSET COMPOSITES MARKET VALUE, BY END USE INDUSTRY, 2021-2030 (USD BILLION)
TABLE 19. U.S THERMOSET COMPOSITES MARKET VALUE, BY FIBER TYPE, 2021-2030 (USD BILLION)
TABLE 20. U.S THERMOSET COMPOSITES MARKET VALUE, BY MANUFACTURING PROCESS, 2021-2030 (USD BILLION)
TABLE 21. CANADA THERMOSET COMPOSITES MARKET VALUE, BY END USE INDUSTRY, 2021-2030 (USD BILLION)
TABLE 22. CANADA THERMOSET COMPOSITES MARKET VALUE, BY FIBER TYPE, 2021-2030 (USD BILLION)
TABLE 23. CANADA THERMOSET COMPOSITES MARKET VALUE, BY MANUFACTURING PROCESS, 2021-2030 (USD BILLION)
TABLE 24. MEXICO THERMOSET COMPOSITES MARKET VALUE, BY END USE INDUSTRY, 2021-2030 (USD BILLION)
TABLE 25. MEXICO THERMOSET COMPOSITES MARKET VALUE, BY FIBER TYPE, 2021-2030 (USD BILLION)
TABLE 26. MEXICO THERMOSET COMPOSITES MARKET VALUE, BY MANUFACTURING PROCESS, 2021-2030 (USD BILLION)
TABLE 27. EUROPE THERMOSET COMPOSITES MARKET VALUE, BY COUNTRY, 2021-2030 (USD BILLION)
TABLE 28. EUROPE THERMOSET COMPOSITES MARKET VALUE, BY END USE INDUSTRY, 2021-2030 (USD BILLION)
TABLE 29. EUROPE THERMOSET COMPOSITES MARKET VALUE, BY FIBER TYPE, 2021-2030 (USD BILLION)
TABLE 30. EUROPE THERMOSET COMPOSITES MARKET VALUE, MANUFACTURING PROCESS, 2021-2030 (USD BILLION)
TABLE 31. GERMANY THERMOSET COMPOSITES MARKET VALUE, BY END USE INDUSTRY, 2021-2030 (USD BILLION)
TABLE 32. GERMANY THERMOSET COMPOSITES MARKET VALUE, BY FIBER TYPE, 2021-2030 (USD BILLION)
TABLE 33. GERMANY THERMOSET COMPOSITES MARKET VALUE, BY MANUFACTURING PROCESS, 2021-2030 (USD BILLION)
TABLE 34. U.K THERMOSET COMPOSITES MARKET VALUE, BY END USE INDUSTRY, 2021-2030 (USD BILLION)
TABLE 35. U.K THERMOSET COMPOSITES MARKET VALUE, BY FIBER TYPE, 2021-2030 (USD BILLION)
TABLE 36. U.K THERMOSET COMPOSITES MARKET VALUE, BY MANUFACTURING PROCESS, 2021-2030 (USD BILLION)
TABLE 37. FRANCE THERMOSET COMPOSITES MARKET VALUE, BY END USE INDUSTRY, 2021-2030 (USD BILLION)
TABLE 38. FRANCE THERMOSET COMPOSITES MARKET VALUE, BY FIBER TYPE, 2021-2030 (USD BILLION)
TABLE 39. FRANCE THERMOSET COMPOSITES MARKET VALUE, BY MANUFACTURING PROCESS, 2021-2030 (USD BILLION)
TABLE 40. ITALY THERMOSET COMPOSITES MARKET VALUE, BY END USE INDUSTRY, 2021-2030 (USD BILLION)
TABLE 41. ITALY THERMOSET COMPOSITES MARKET VALUE, BY FIBER TYPE, 2021-2030 (USD BILLION)
TABLE 42. ITALY THERMOSET COMPOSITES MARKET VALUE, BY MANUFACTURING PROCESS, 2021-2030 (USD BILLION)
TABLE 43. SPAIN THERMOSET COMPOSITES MARKET VALUE, BY END USE INDUSTRY, 2021-2030 (USD BILLION)
TABLE 44. SPAIN THERMOSET COMPOSITES MARKET VALUE, BY FIBER TYPE, 2021-2030 (USD BILLION)
TABLE 45. SPAIN THERMOSET COMPOSITES MARKET VALUE, BY MANUFACTURING PROCESS, 2021-2030 (USD BILLION)
TABLE 46. ROE THERMOSET COMPOSITES MARKET VALUE, BY END USE INDUSTRY, 2021-2030 (USD BILLION)
TABLE 47. ROE THERMOSET COMPOSITES MARKET VALUE, BY FIBER TYPE, 2021-2030 (USD BILLION)
TABLE 48. ROE THERMOSET COMPOSITES MARKET VALUE, BY MANUFACTURING PROCESS, 2021-2030 (USD BILLION)
TABLE 49. ASIA PACIFIC THERMOSET COMPOSITES MARKET VALUE, BY COUNTRY, 2021-2030 (USD BILLION)
TABLE 50. ASIA PACIFIC THERMOSET COMPOSITES MARKET VALUE, BY END USE INDUSTRY, 2021-2030 (USD BILLION)
TABLE 51. ASIA PACIFIC THERMOSET COMPOSITES MARKET VALUE, BY FIBER TYPE, 2021-2030 (USD BILLION)
TABLE 52. ASIA PACIFIC THERMOSET COMPOSITES MARKET VALUE, BY MANUFACTURING PROCESS, 2021-2030 (USD BILLION)
TABLE 53. CHINA THERMOSET COMPOSITES MARKET VALUE, BY END USE INDUSTRY, 2021-2030 (USD BILLION)
TABLE 54. CHINA THERMOSET COMPOSITES MARKET VALUE, BY FIBER TYPE, 2021-2030 (USD BILLION)
TABLE 55. CHINA THERMOSET COMPOSITES MARKET VALUE, BY MANUFACTURING PROCESS, 2021-2030 (USD BILLION)
TABLE 56. INDIA THERMOSET COMPOSITES MARKET VALUE, BY END USE INDUSTRY, 2021-2030 (USD BILLION)
TABLE 57. INDIA THERMOSET COMPOSITES MARKET VALUE, BY FIBER TYPE, 2021-2030 (USD BILLION)
TABLE 58. INDIA THERMOSET COMPOSITES MARKET VALUE, BY MANUFACTURING PROCESS, 2021-2030 (USD BILLION)
TABLE 59. JAPAN THERMOSET COMPOSITES MARKET VALUE, BY END USE INDUSTRY, 2021-2030 (USD BILLION)
TABLE 60. JAPAN THERMOSET COMPOSITES MARKET VALUE, BY FIBER TYPE, 2021-2030 (USD BILLION)
TABLE 61. JAPAN THERMOSET COMPOSITES MARKET VALUE, BY MANUFACTURING PROCESS, 2021-2030 (USD BILLION)
TABLE 62. REST OF APAC THERMOSET COMPOSITES MARKET VALUE, BY END USE INDUSTRY, 2021-2030 (USD BILLION)
TABLE 63. REST OF APAC THERMOSET COMPOSITES MARKET VALUE, BY FIBER TYPE, 2021-2030 (USD BILLION)
TABLE 64. REST OF APAC THERMOSET COMPOSITES MARKET VALUE, BY MANUFACTURING PROCESS, 2021-2030 (USD BILLION)
TABLE 65. LATIN AMERICA THERMOSET COMPOSITES MARKET VALUE, BY END USE INDUSTRY, 2021-2030 (USD BILLION)
TABLE 66. LATIN AMERICA THERMOSET COMPOSITES MARKET VALUE, BY FIBER TYPE, 2021-2030 (USD BILLION)
TABLE 67. LATIN AMERICA THERMOSET COMPOSITES MARKET VALUE, BY MANUFACTURING PROCESS, 2021-2030 (USD BILLION)
TABLE 68. BRAZIL THERMOSET COMPOSITES MARKET VALUE, BY END USE INDUSTRY, 2021-2030 (USD BILLION)
TABLE 69. BRAZIL THERMOSET COMPOSITES MARKET VALUE, BY FIBER TYPE, 2021-2030 (USD BILLION)
TABLE 70. BRAZIL THERMOSET COMPOSITES MARKET VALUE, BY MANUFACTURING PROCESS, 2021-2030 (USD BILLION)
TABLE 71. ARGENTINA THERMOSET COMPOSITES MARKET VALUE, BY END USE INDUSTRY, 2021-2030 (USD BILLION)
TABLE 72. ARGENTINA THERMOSET COMPOSITES MARKET VALUE, BY FIBER TYPE, 2021-2030 (USD BILLION)
TABLE 73. ARGENTINA THERMOSET COMPOSITES MARKET VALUE, BY MANUFACTURING PROCESS, 2021-2030 (USD BILLION)
TABLE 74. MIDDLE EAST AND AFRICA THERMOSET COMPOSITES MARKET VALUE, BY END USE INDUSTRY, 2021-2030 (USD BILLION)
TABLE 75. MIDDLE EAST AND AFRICA THERMOSET COMPOSITES MARKET VALUE, BY FIBER TYPE, 2021-2030 (USD BILLION)
TABLE 76. MIDDLE EAST AND AFRICA THERMOSET COMPOSITES MARKET VALUE, BY MANUFACTURING PROCESS, 2021-2030 (USD BILLION)
TABLE 77. SAUDI ARABIA THERMOSET COMPOSITES MARKET VALUE, BY END USE INDUSTRY, 2021-2030 (USD BILLION)
TABLE 78. SAUDI ARABIA THERMOSET COMPOSITES MARKET VALUE, BY FIBER TYPE, 2021-2030 (USD BILLION)
TABLE 79. SAUDI ARABIA THERMOSET COMPOSITES MARKET VALUE, BY MANUFACTURING PROCESS, 2021-2030 (USD BILLION)
TABLE 80. UAE THERMOSET COMPOSITES MARKET VALUE, BY END USE INDUSTRY, 2021-2030 (USD BILLION)
TABLE 81. UAE THERMOSET COMPOSITES MARKET VALUE, BY FIBER TYPE, 2021-2030 (USD BILLION)
TABLE 82. UAE THERMOSET COMPOSITES MARKET VALUE, BY MANUFACTURING PROCESS, 2021-2030 (USD BILLION)
TABLE 83. REST OF MIDDLE EAST AND AFRICA THERMOSET COMPOSITES MARKET VALUE, BY END USE INDUSTRY, 2021-2030 (USD BILLION)
TABLE 84. REST OF MIDDLE EAST AND AFRICA THERMOSET COMPOSITES MARKET VALUE, BY FIBER TYPE, 2021-2030 (USD BILLION)
TABLE 85. REST OF MIDDLE EAST AND AFRICA THERMOSET COMPOSITES MARKET VALUE, BY MANUFACTURING PROCESS, 2021-2030 (USD BILLION)
TABLE 86. OWENS CORNING: FINANCIALS
TABLE 87. OWENS CORNING: PRODUCTS & SERVICES
TABLE 88. OWENS CORNING: RECENT DEVELOPMENTS
TABLE 89. TORAY INDUSTRIES, INC: FINANCIALS
TABLE 90. TORAY INDUSTRIES, INC: PRODUCTS & SERVICES
TABLE 91. TORAY INDUSTRIES, INC: RECENT DEVELOPMENTS
TABLE 92. JEC GROUP: FINANCIALS
TABLE 93. JEC GROUP: : PRODUCTS & SERVICES
TABLE 94. JEC GROUP: RECENT DEVELOPMENTS
TABLE 95. HEXCEL CORPORATION: FINANCIALS
TABLE 96. HEXCEL CORPORATION: PRODUCTS & SERVICES
TABLE 97. HEXCEL CORPORATION: RECENT DEVELOPMENTS
TABLE 98. MITSUBISHI CHEMICAL CORPORATION: FINANCIALS
TABLE 99. MITSUBISHI CHEMICAL CORPORATION: PRODUCTS & SERVICES
TABLE 100. MITSUBISHI CHEMICAL CORPORATION: RECENT DEVELOPMENTS
TABLE 101. TEIJIN ARAMID B.V: FINANCIALS
TABLE 102. TEIJIN ARAMID B.V.: PRODUCTS & SERVICES
TABLE 103. TEIJIN ARAMID B.V.: RECENT DEVELOPMENTS
TABLE 104. SGL CARBON: FINANCIALS
TABLE 105. SGL CARBON: PRODUCTS & SERVICES
TABLE 106. SGL CARBON: RECENT DEVELOPMENTS
TABLE 107. HUNTSMAN INTERNATIONAL LLC.: FINANCIALS
TABLE 108. HUNTSMAN INTERNATIONAL LLC.: PRODUCTS & SERVICES
TABLE 109. HUNTSMAN INTERNATIONAL LLC.: RECENT DEVELOPMENTS
TABLE 110. ARKEMA: FINANCIALS
TABLE 111. ARKEMA: PRODUCTS & SERVICES
TABLE 112. ARKEMA: RECENT DEVELOPMENTS
TABLE 113. PPG INDUSTRIES: FINANCIALS
TABLE 114. PPG INDUSTRIES: PRODUCTS & SERVICES
TABLE 115. PPG INDUSTRIES: RECENT DEVELOPMENTS


